
Short answer
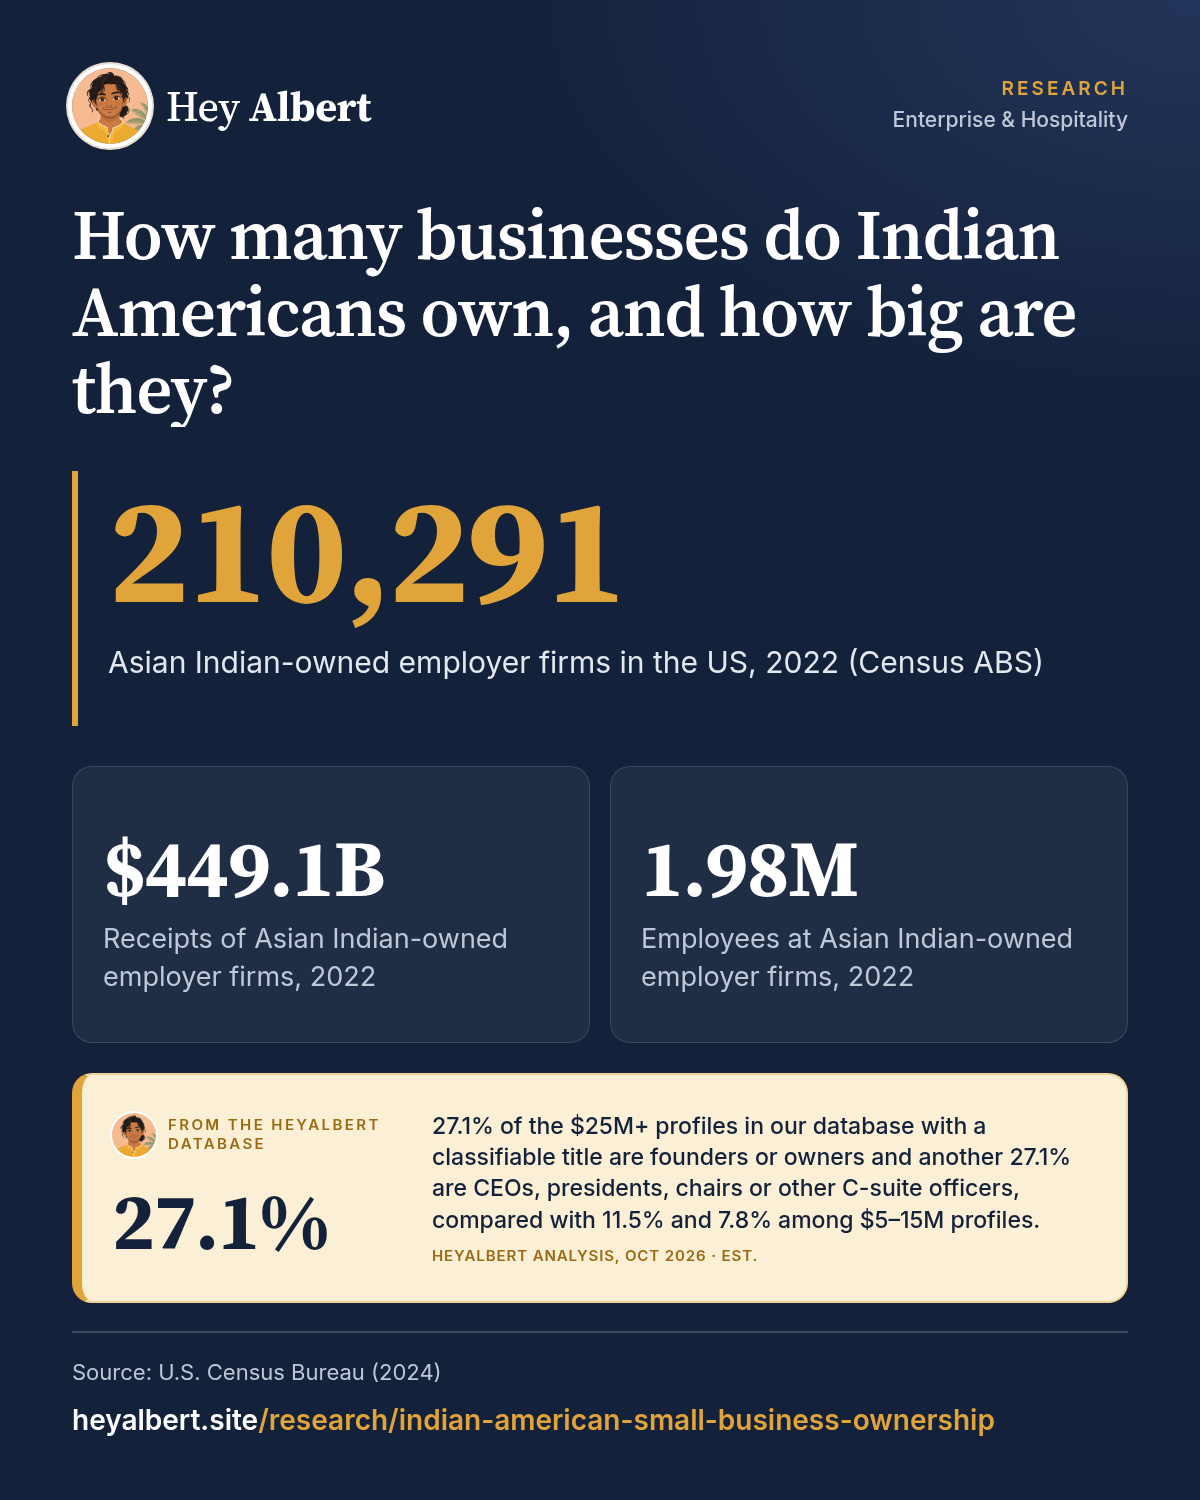
Asian Indian Americans owned 210,291 US businesses with paid employees in 2022, the most of any Asian American group, and those firms reported $449.1 billion in receipts, 1.98 million employees and $94.5 billion in payroll, according to the Census Bureau's Annual Business Survey1. Indian American-owned employer firms averaged about $2.1 million in receipts, above the average for Asian-owned firms overall1.
HeyAlbert data shows 27.1% of the $25M+ profiles in our database with a classifiable title are founders or owners and another 27.1% are CEOs, presidents, chairs or other C-suite officers, compared with 11.5% and 7.8% among $5–15M profiles. See the data · Methodology
The official count
The Census Bureau's Annual Business Survey (ABS) is the authoritative source on business ownership by race, and it breaks out Asian Indian owners separately. In 2022, the latest detailed year, Asian Indian Americans owned 210,291 employer firms, meaning businesses with at least one paid employee1. That is about a third of the 650,680 Asian-owned employer firms in the US and more than any other Asian American group; Chinese American owners were next with 151,4441,2.
Those firms reported $449.1 billion in receipts, employed 1,976,437 people and paid $94.5 billion in annual payroll1. Asian Indian-owned businesses make up about 3.6% of all US employer firms (our calculation from the ABS), while people who identify as Asian Indian alone are about 1.5% of the US population, at 5.09 million in 20241,3.
| Employer firms, 2022 | Firms | Receipts | Employees |
|---|---|---|---|
| Asian Indian-owned | 210,291 | $449.1B | 1,976,437 |
| Chinese-owned | 151,444 | $285.0B | 1,179,985 |
| Korean-owned | 87,354 | $161.0B | 643,624 |
| All Asian-owned | 650,680 | $1.19T | 5,368,251 |
Source: US Census Bureau, Annual Business Survey 20221. Firms whose owners identify with more than one group are counted in each.
What HeyAlbert data shows
How big are they?
Most Indian American-owned firms are small or mid-sized operating businesses rather than large corporations. On the ABS figures, the average Asian Indian-owned employer firm had about $2.1 million in receipts and 9 employees, compared with about $1.8 million and 8 employees for Asian-owned firms overall (our calculations from the ABS totals)1. Payroll averaged roughly $450,000 per Asian Indian-owned firm, or about $47,800 per employee (our calculations)1. Averages for all US firms are not comparable because they include the largest public companies.
Receipts are revenue, not profit or owner wealth. But an operating business with millions in annual sales, often paired with the real estate it occupies, is one of the most common foundations of family wealth, a theme explored in what role family businesses play in Indian American wealth creation.
Which industries?
Ownership is concentrated in four sectors that together account for about 80% of Asian Indian-owned employer firms (our calculation)1:
| Sector | Asian Indian-owned firms | Receipts | Share of all US firms in sector |
|---|---|---|---|
| Retail trade | 57,877 | $132.2B | 9.3% |
| Accommodation and food services | 44,440 | $57.4B | 8.0% |
| Professional, scientific and technical services | 35,945 | $80.2B | 4.3% |
| Health care and social assistance | 29,371 | $39.3B | 4.4% |
Source: Census ABS 20221; shares are our calculations.
- Retail, including gas stations and convenience stores, is the single largest category; roughly one in eleven US retail employer firms is Asian Indian-owned. See how Indian American franchise and convenience store owners build wealth.
- Accommodation and food services covers hotels and motels, where Indian American ownership is famously concentrated; see how many US hotels Indian Americans own. With 605,446 employees, it is the largest employer among these sectors1.
- Professional and technical services includes IT consulting, engineering and accounting firms, discussed in Indian American IT services and staffing firms.
- Health care reflects physician practices and other clinics; see how many US doctors are of Indian origin.
Wholesale and manufacturing: fewer firms, bigger tickets
Some sectors have far fewer Indian American owners but larger firms. Asian Indian-owned wholesale businesses numbered 6,335 yet reported $52.2 billion in receipts, and 2,327 manufacturing firms reported $18.7 billion, averaging roughly $8 million per firm in each sector (our calculations)1. Real estate and rental firms numbered 4,9121, though much Indian American property wealth is held through hotel and investment entities classified elsewhere; see Indian American real estate developers.
What drives the high rate of ownership
Several factors stand out in the research: high education and professional credentials that support practices and consulting firms; family networks that pool capital and labor, especially in hotels and retail; and immigrant entrepreneurship more broadly. Business income is one reason household incomes are high: Asian Indian households had a median income of $165,721 in 2024, against $81,604 for all US households3. For the bigger picture, see how much Indian Americans contribute to the US economy.
Limits of the data
The ABS covers employer firms; it is separate from the far larger number of businesses with no employees, such as sole consultants. It classifies firms by the race of owners holding a majority stake, and counts a firm in more than one group when owners report multiple races1. Publicly traded companies founded or led by Indian Americans are generally not classifiable by owner race and fall outside these figures.
Frequently asked questions
How many businesses do Indian Americans own?
Asian Indian Americans owned 210,291 US businesses with paid employees in 2022, according to the Census Bureau's Annual Business Survey. That count excludes businesses with no employees.
How much revenue do Indian American-owned businesses generate?
Asian Indian-owned employer firms reported $449.1 billion in receipts in 2022 and employed nearly 2 million people.
What industries do Indian American business owners work in?
The largest sectors are retail trade, accommodation and food services, professional and technical services, and health care, which together account for about four in five Asian Indian-owned employer firms.
Do Indian Americans own more businesses than other Asian American groups?
Yes. Asian Indian owners hold about a third of all Asian-owned employer firms, ahead of Chinese American owners, according to the 2022 Annual Business Survey.
Sources
Figures are from the public sources below, with the data year stated. Estimates are labeled as estimates. Accessed October 24, 2026.
- US Census Bureau, Annual Business Survey: Statistics for Employer Firms by Industry, Sex, Ethnicity, Race, and Veteran Status for the U.S.: 2022 (AB2200CSA01) (2024). data.census.gov ↩ ↩ ↩
- US Census Bureau, Census Bureau Releases New Data on Minority-Owned, Veteran-Owned and Women-Owned Businesses (2024). census.gov ↩
- US Census Bureau, American Community Survey 2024 1-year, Selected Population Profile (S0201), Asian Indian alone (2025). data.census.gov ↩ ↩