
Short answer
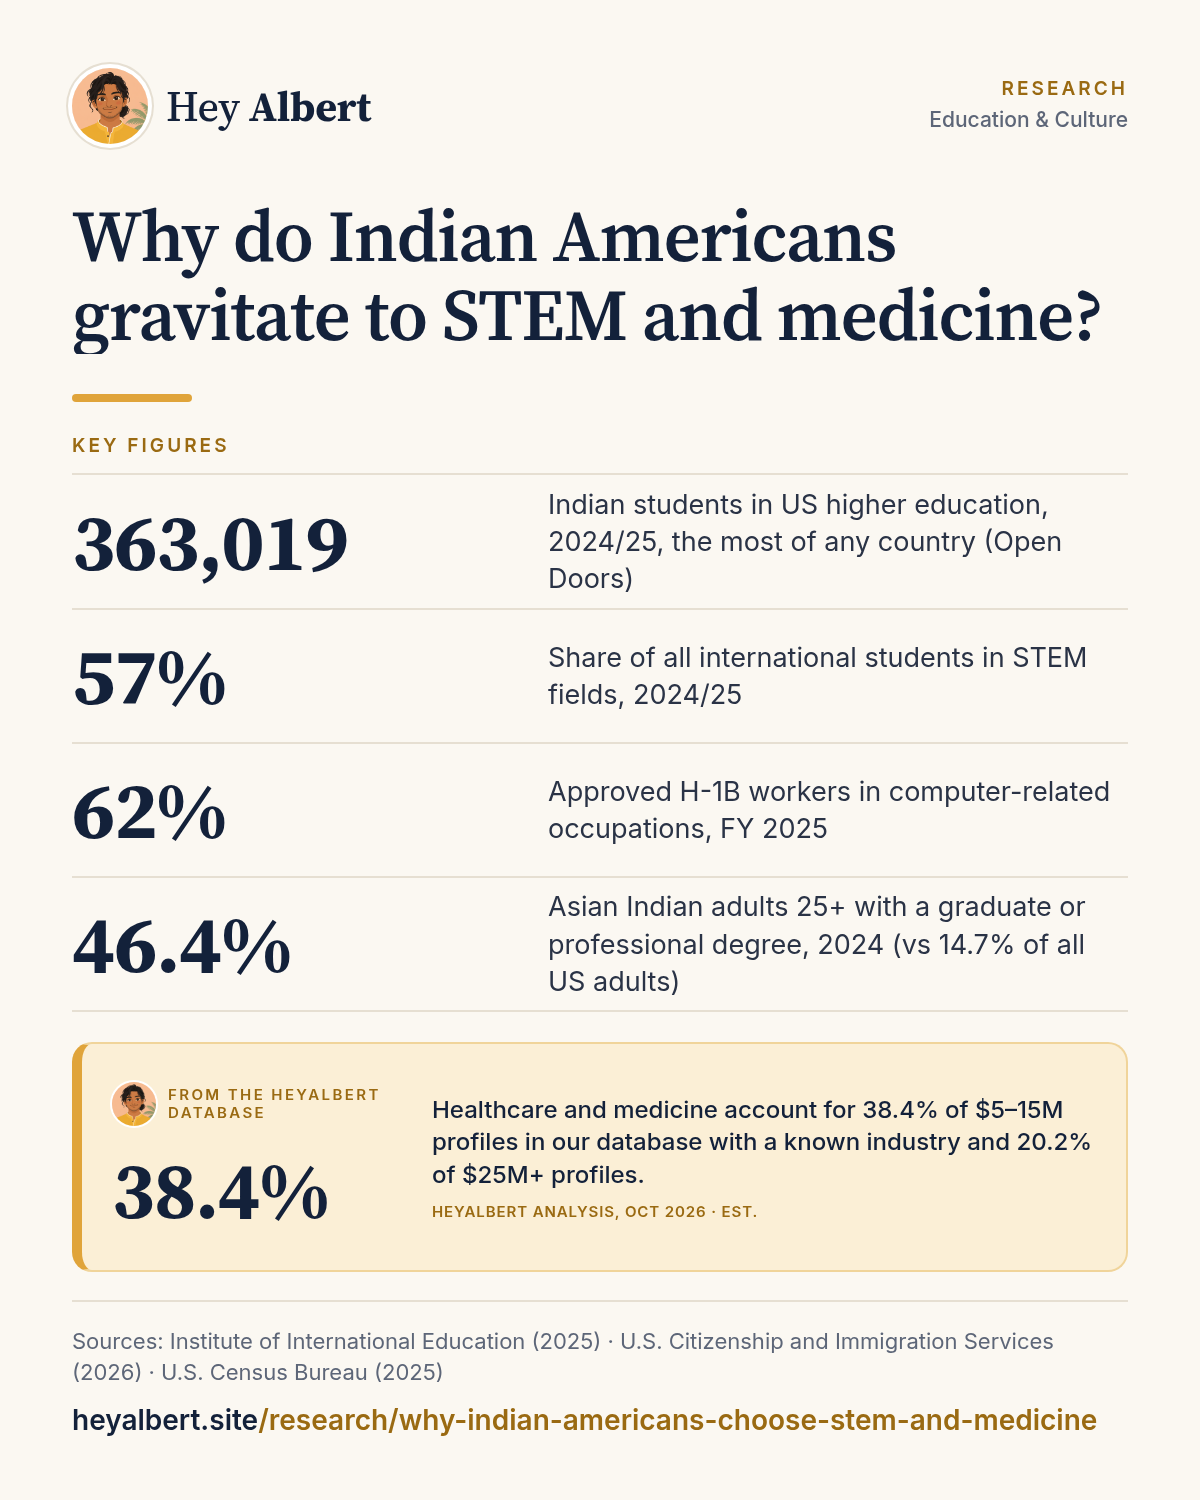
The concentration of Indian Americans in STEM and medicine is largely a product of how they arrived: US immigration channels such as the H-1B visa and graduate student visas select for technical degrees, and in fiscal 2025, 62% of approved H-1B workers were in computer-related jobs and 70% were born in India1. High pay, portable credentials and strong professional networks then reinforce the pattern across generations; India-born physicians alone number more than 62,8004.
HeyAlbert data shows healthcare and medicine account for 38.4% of $5–15M profiles in our database with a known industry and 20.2% of $25M+ profiles. See the data · Methodology
Selective immigration is the biggest factor
Most Indian Americans are immigrants or the children of immigrants, and the main doors into the US for Indians have favored technical and medical skills. The H-1B visa requires at least a bachelor's degree in a specialty field; in fiscal 2025, 62% of approved H-1B beneficiaries worked in computer-related occupations, 57.5% held a master's degree and 70% were born in India1. Medicine had its own pathway through residency training for international medical graduates, and India is the leading country of birth for immigrant doctors in the US4.
Students are the other door. India sent 363,019 students to US colleges and universities in 2024/25, more than any other country, and 57% of all international students studied STEM fields, with one in four in math and computer science and nearly one in five in engineering2. Many stay on to work: the number of international students in Optional Practical Training, the post-study work program, grew 21% to 294,2532. The visa side of this story is told in the H-1B visa and Indian American wealth.
What HeyAlbert data shows
Education as the family strategy
The result is a population with exceptional formal education. In 2024, 78.8% of Asian Indian adults aged 25 and older held at least a bachelor's degree and 46.4% held a graduate or professional degree, compared with 36.8% and 14.7% of all US adults3. Many arrived after studying at India's selective engineering and medical colleges, a route traced in the path from IIT and IIM to US leadership; the broader numbers are in Indian American education levels.
| Adults 25+, ACS 2024 | Asian Indian alone | All US |
|---|---|---|
| Bachelor's degree or higher | 78.8% | 36.8% |
| Graduate or professional degree | 46.4% | 14.7% |
Source: US Census Bureau, ACS 2024 1-year, S02013.
The economics: portable, well-paid credentials
For an immigrant family, a STEM or medical credential has clear advantages. It is portable across borders and employers, it is valued on objective criteria rather than personal networks, and it pays well. The median offered salary for H-1B workers was $133,000 in fiscal 20251, and the median wage for US physicians and surgeons was at least $239,200 in May 20245. Those incomes, often earned by two professionals in one household, help explain Indian American median household income, which reached $165,721 for Asian Indian households in 2024 against $81,604 for all US households3.
Technical careers also open the door to equity. Engineers at fast-growing companies receive stock, and some go on to found companies; Indian-born founders appear in 96 US unicorns, more than any other country6, as detailed in our analysis of Indian-born unicorn founders.
What the occupation data show
Census occupation data confirm how concentrated Indian Americans are in professional work. In 2024, 75.7% of employed Asian Indian Americans worked in management, business, science and arts occupations, the category that contains engineers, software developers, scientists, physicians and managers, compared with 43.5% of all US workers3. Only 6.3% worked in service occupations and 11.1% in sales and office jobs, against 16.5% and 19.1% nationally3.
| Occupation group, ACS 2024 | Asian Indian alone | All US |
|---|---|---|
| Management, business, science and arts | 75.7% | 43.5% |
| Service | 6.3% | 16.5% |
| Sales and office | 11.1% | 19.1% |
Source: US Census Bureau, ACS 2024 1-year, S02013. The survey's broad categories do not separate STEM from other professional jobs, so they show the direction of the pattern rather than an exact STEM share.
Networks and role models
Once a community is established in a field, it tends to grow. Experienced professionals mentor newcomers, refer them for jobs and fund their startups, and professional associations formalize those ties. The American Association of Physicians of Indian Origin describes itself as the voice of more than 16,000 physicians of Indian origin7, and entrepreneurship networks play a similar role in technology. See TiE, AAPI and other professional networks and how many US doctors are of Indian origin.
Changing patterns in the second generation
The tilt is not destiny. US-born Indian Americans grow up with different options and pressures than their immigrant parents, and many choose law, finance, consulting, media, public service and entrepreneurship. Averages also hide variation: newer arrivals, family-sponsored immigrants and small-business families follow different paths, as the strong presence of Indian Americans in hotels and retail shows. Those differences are explored in second-generation Indian Americans' incomes. Policy shifts, including the $100,000 payment now required for most new H-1B petitions8, may also change who arrives and what they study in the years ahead.
Frequently asked questions
Why are so many Indian Americans engineers and doctors?
Largely because of selective immigration: the H-1B and student visa routes favor technical degrees, and international medical graduate pathways brought many Indian doctors. Portable, well-paid credentials and strong professional networks then reinforce the pattern.
How many Indian students study STEM in the US?
India sent 363,019 students to US higher education in 2024/25, the most of any country. Across all international students, 57% studied STEM fields, according to Open Doors.
How educated are Indian Americans?
In 2024, 78.8% of Asian Indian adults 25 and older held at least a bachelor's degree and 46.4% held a graduate or professional degree, compared with 36.8% and 14.7% of all US adults.
Do second-generation Indian Americans also choose STEM?
Many do, but US-born Indian Americans increasingly pursue law, finance, consulting, media, public service and entrepreneurship as well.
Sources
Figures are from the public sources below, with the data year stated. Estimates are labeled as estimates. Accessed October 24, 2026.
- US Citizenship and Immigration Services, Characteristics of H-1B Specialty Occupation Workers, Fiscal Year 2025 Annual Report to Congress (2026). uscis.gov ↩ ↩ ↩
- Institute of International Education, Open Doors: International Students (2025 annual release) (2025). opendoorsdata.org ↩ ↩ ↩
- US Census Bureau, American Community Survey 2024 1-year, Selected Population Profile (S0201), Asian Indian alone (2025). data.census.gov ↩ ↩ ↩
- American Immigration Council, Which Countries Do Immigrant Healthcare Workers Come From? (2026). americanimmigrationcouncil.org ↩ ↩ ↩
- USAFacts, How much money do doctors make in the US? (BLS data) (2025). usafacts.org ↩
- National Foundation for American Policy, Immigrants and U.S. Billion-Dollar Companies (NFAP Policy Brief, June 2026) (2026). nfap.com ↩
- AAPI, American Association of Physicians of Indian Origin (homepage) (2026). aapiusa.org ↩
- The White House, Restriction on Entry of Certain Nonimmigrant Workers (proclamation extending the 2025 H-1B restriction) (2026). whitehouse.gov ↩