
Short answer
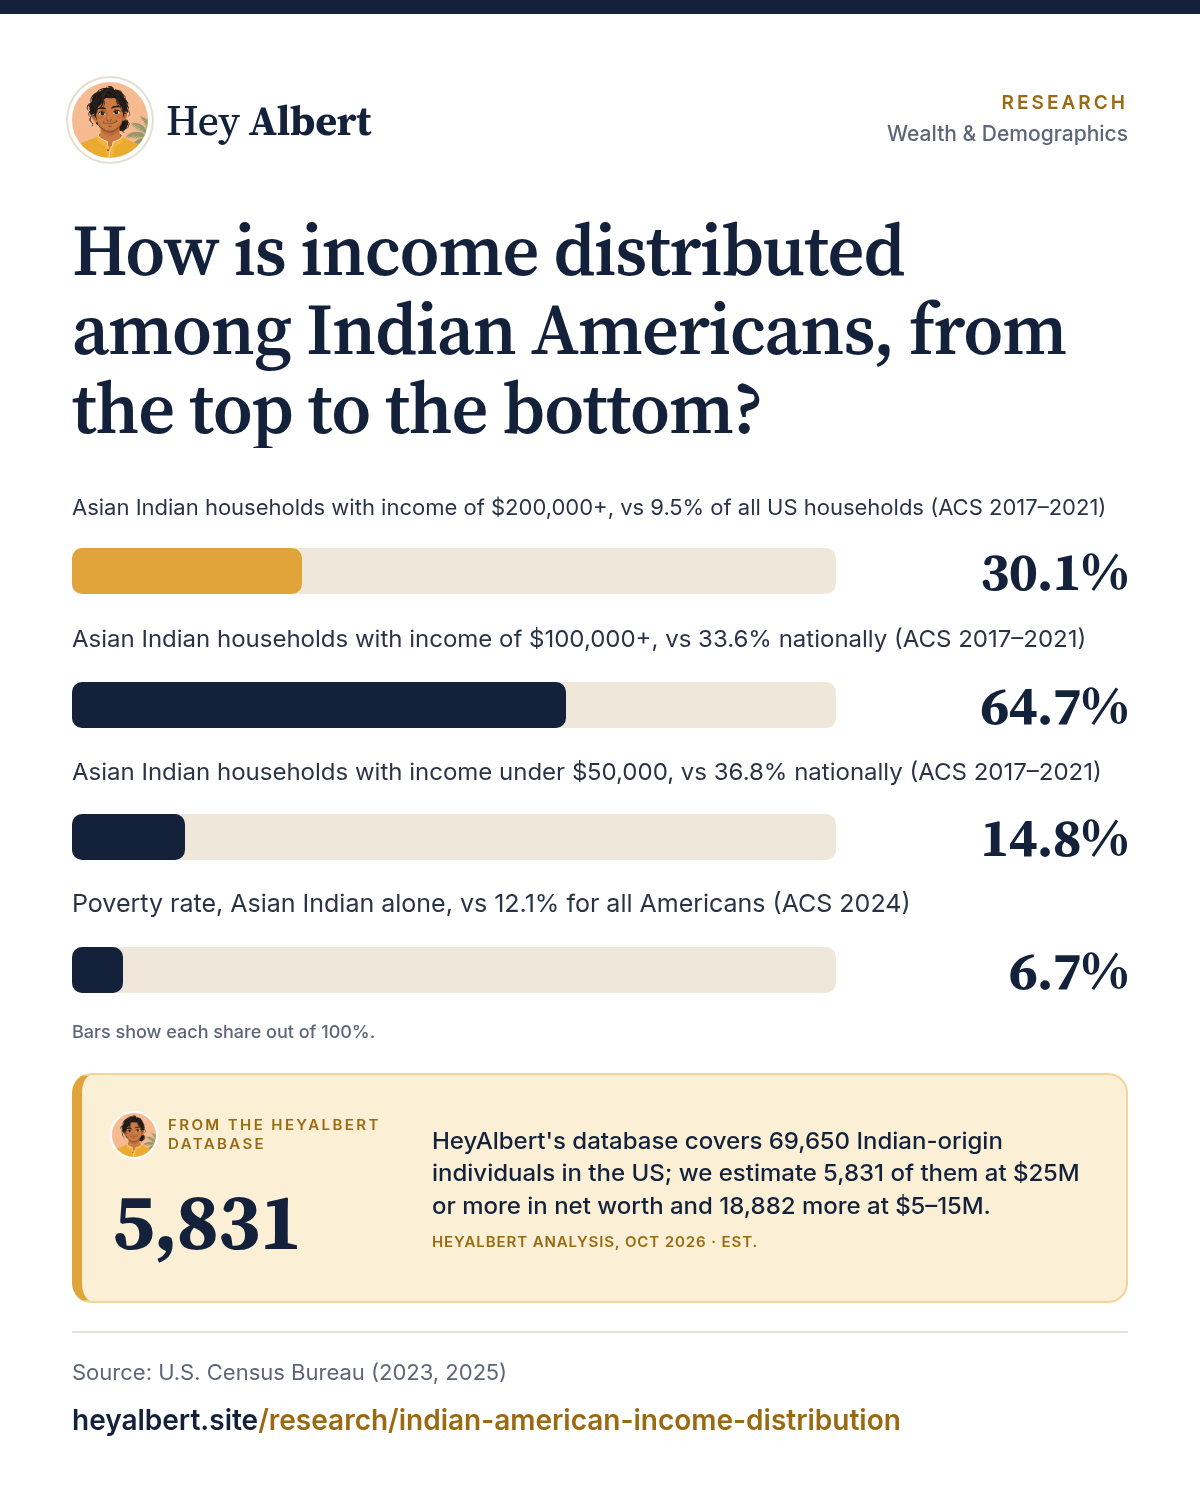
Indian American household incomes are concentrated at the top: in the Census Bureau's 2017–2021 data, 30.1% of Asian Indian households had incomes of $200,000 or more, compared with 9.5% of all US households, and about 65% earned $100,000 or more1. At the other end, about 15% earned under $50,000, and 6.7% of Asian Indians lived in poverty in 20241,2.
HeyAlbert data shows HeyAlbert's database covers 69,650 Indian-origin individuals in the US; we estimate 5,831 of them at $25M or more in net worth and 18,882 more at $5–15M. See the data · Methodology
The shape of the distribution
Medians summarize a whole population in one number. To see the spread, the best public source is the Census Bureau's household income brackets for Asian Indian households, published in its 2017–2021 five-year detailed tables, the most recent release with this level of detail for the group1.
| Household income | Asian Indian alone | Asian alone | White, not Hispanic | All US households |
|---|---|---|---|---|
| Under $25,000 | 7.2% | 13.3% | 14.8% | 17.2% |
| $25,000–$49,999 | 7.6% | 13.0% | 18.3% | 19.6% |
| $50,000–$99,999 | 20.5% | 24.4% | 30.0% | 29.6% |
| $100,000–$149,999 | 20.3% | 18.3% | 17.5% | 16.3% |
| $150,000–$199,999 | 14.3% | 11.6% | 8.6% | 7.8% |
| $200,000 or more | 30.1% | 19.4% | 10.7% | 9.5% |
The single largest bracket for Asian Indian households is the top one. Nearly a third of households report $200,000 or more a year, more than three times the national share. Nearly two-thirds (64.7%) earn at least $100,0001. Since these figures were collected, the Asian Indian median has risen further, to $165,721 in 20242, so today's top-bracket share is likely higher; see Indian American median household income.
What HeyAlbert data shows
The top of the distribution
Census brackets stop at $200,000, so they cannot show how many households earn far more. Pew Research Center's analysis of 2022 ACS data, adjusted for household size, found that Indian Americans had the highest incomes of any Asian origin group at the 90th percentile; Chinese American households were second, at $200,0003. Mean earnings also hint at a long upper tail: among Asian Indian households with earnings, the mean was $212,461 in 2024, well above the $165,721 median household income2. The two measures are not strictly comparable (one counts only earnings, the other all income), but a mean this far above a median usually signals a relatively small number of very high earners pulling the average up.
For the very top, the people with eight- and nine-figure fortunes, survey data runs out and lists such as Forbes take over. We cover that in how many Indian American millionaires and billionaires there are and who the richest Indian Americans are.
The bottom of the distribution
A minority of Indian American households have modest or low incomes. In 2017–2021, 7.2% of Asian Indian households earned under $25,000 and 14.8% earned under $50,0001. In 2024, 6.7% of Asian Indians lived below the poverty line, including 4.6% of children and 7.7% of people aged 65 and older2. National rates were 12.1%, 15.5% and 11.2%4.
Who is at the bottom? Pew found that, across the largest Asian origin groups, people in the lowest-earning households are more likely to be recent immigrants. Among Indian American immigrants, 71% of those in the highest-earning households had lived in the US for more than 10 years, compared with 53% in the lowest-earning households3. Students, retirees who joined adult children, and workers in lower-paid jobs are all part of the picture. The age and arrival profile is explored in foreign-born versus US-born Indian Americans.
Is inequality rising?
Yes, within most large Asian American groups. Pew measured income inequality with the 90/10 ratio, the income of a household at the 90th percentile divided by one at the 10th. It found that inequality rose among Indian, Korean, Japanese and Filipino American households between 1980 and 2022, with the biggest rise among Chinese Americans3. Indian Americans were the highest-earning Asian group at both the 10th and 90th percentiles in 20223, so the community's whole distribution sits higher than other groups', but the distance between its top and bottom has grown.
Wealth is spread even more unevenly than income. Among all Asian American households in the Federal Reserve's 2022 survey, the 90th percentile of net worth was more than $3 million, about 230 times the 10th percentile5; see Indian American household net worth.
What drives the spread
The top of the distribution reflects two-earner professional households in high-wage metros, often in technology, medicine and finance. In 2024, 92.9% of Asian Indian households had earnings from work and 69.7% were married-couple households2. Geography matters too: the Asian Indian median household income ranged from $230,380 in Washington and $212,558 in California to $124,215 in New York in 2024, reflecting differences in local industries, household composition and living costs6. The lower end includes newer arrivals, older relatives and people in service and retail work. For the drivers at the top, see why Indian Americans are wealthier than average; for how the picture compares across groups, see Indian American wealth compared with other groups.
Frequently asked questions
What share of Indian American households earn over $200,000?
About 30.1% in the Census Bureau's 2017 to 2021 data, compared with 9.5% of all US households. With incomes rising since, the share is likely higher today.
What percentage of Indian Americans live in poverty?
6.7% of people identifying as Asian Indian alone lived below the poverty line in 2024, compared with 12.1% of all Americans.
What percentage of top 1% earners in America are Indian?
No official source publishes this. Census income brackets stop at $200,000 and tax data is not reported by ethnicity, so any specific figure for the top 1% should be treated with caution.
Is income inequality high among Indian Americans?
It has risen since 1980, according to Pew Research Center, but it is lower than among Chinese Americans, who had the highest inequality of any Asian origin group in 2022.
Sources
Figures are from the public sources below, with the data year stated. Estimates are labeled as estimates. Accessed October 24, 2026.
- U.S. Census Bureau, Household Income in the Past 12 Months (B19001), 2017–2021 ACS 5-year Selected Population Detailed Tables (2023). data.census.gov ↩ ↩ ↩
- U.S. Census Bureau, Selected Population Profile in the United States (S0201): Asian Indian alone, 2024 ACS 1-year estimates (2025). data.census.gov ↩ ↩ ↩
- Pew Research Center, Income inequality is greater among Chinese Americans than any other Asian origin group in the U.S. (2024). pewresearch.org ↩ ↩ ↩
- U.S. Census Bureau, Selected Population Profile in the United States (S0201): Total population, 2024 ACS 1-year estimates (2025). data.census.gov ↩
- Urban Institute, A Snapshot of Asian Wealth in America (2025). apps.urban.org ↩
- U.S. Census Bureau, Selected Population Profile (S0201): Asian Indian alone, by state, 2024 ACS 1-year estimates (2025). data.census.gov ↩