
Short answer
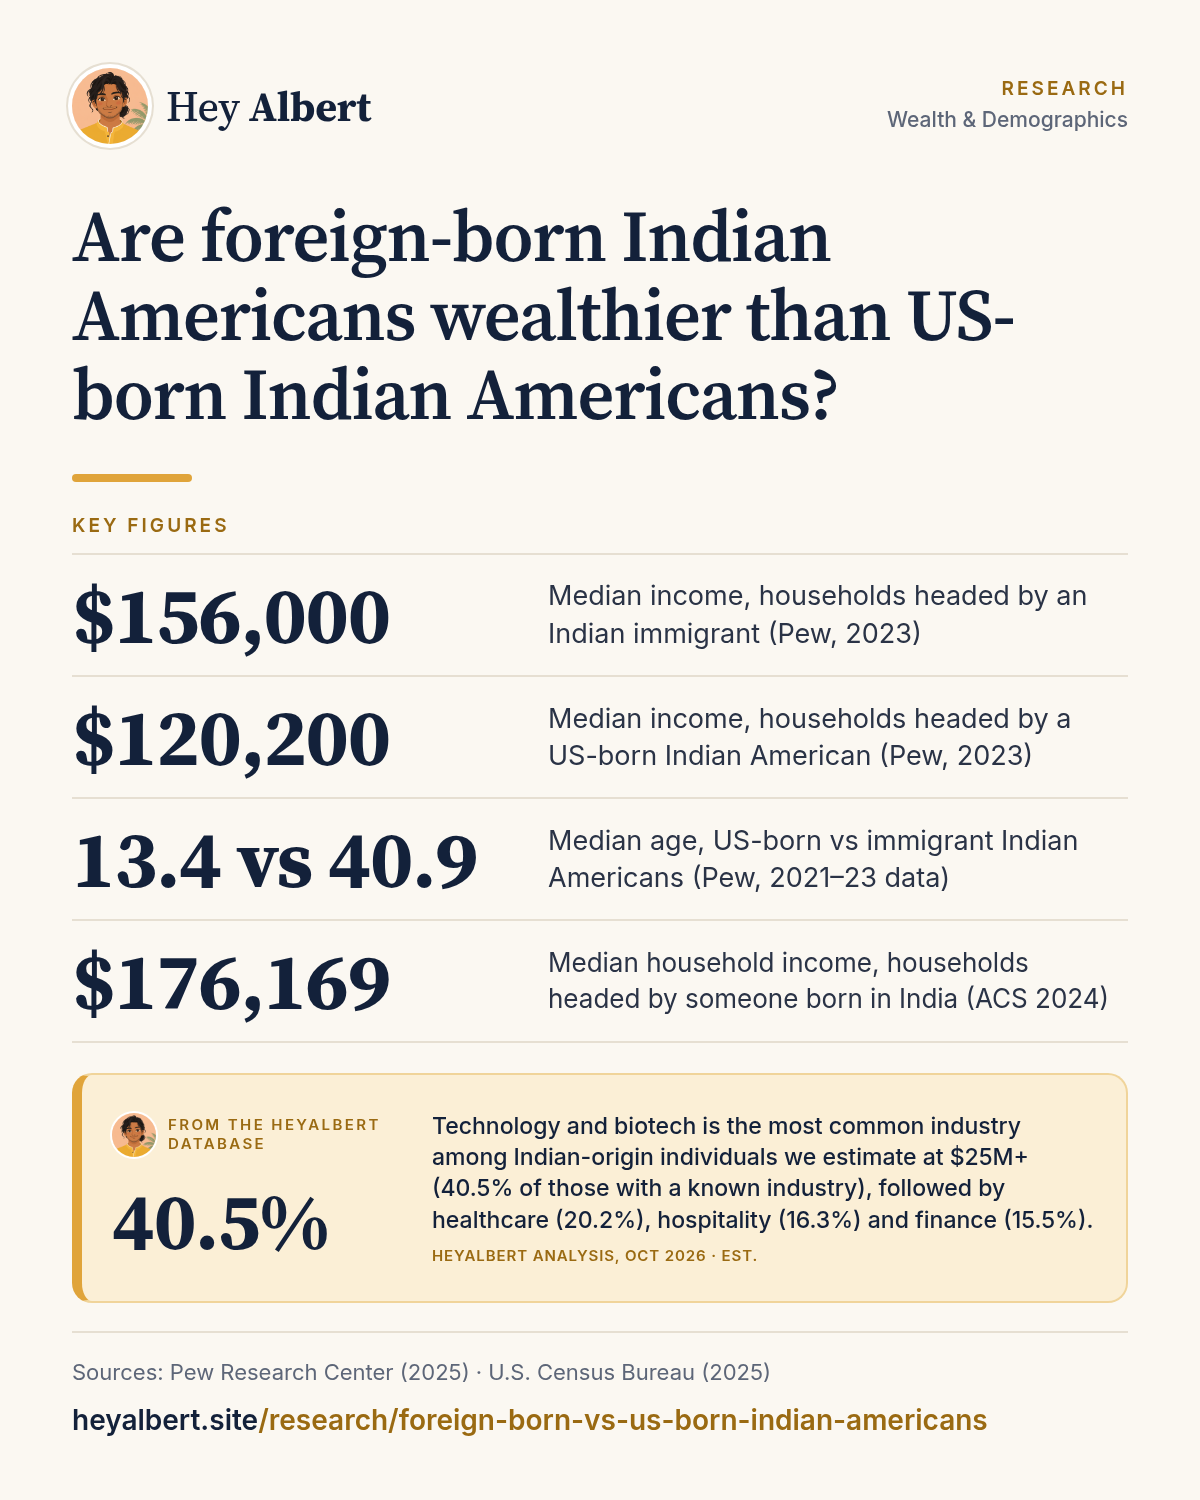
By household income, yes for now: Pew Research Center found households headed by an Indian immigrant had a median income of $156,000 in 2023, versus $120,200 for households headed by a US-born Indian American1. But the comparison is skewed by age. The median US-born Indian American is 13.4 years old, against 40.9 for immigrants, so most US-born household heads are early in their careers, and both groups are equally likely to hold a bachelor's degree (76% versus 77%)1.
HeyAlbert data shows technology and biotech is the most common industry among Indian-origin individuals we estimate at $25M+ (40.5% of those with a known industry), followed by healthcare (20.2%), hospitality (16.3%) and finance (15.5%). See the data · Methodology
Two very different populations
Of the roughly 5.1 million people who identified as Asian Indian alone in 2024, about 3.5 million (69%) were born outside the US and about 1.6 million were born here3. The two groups are at very different stages of life. Pew Research Center's analysis of 2021–23 data put the median age of Indian immigrants at 40.9 and of US-born Indian Americans at 13.4; six in ten US-born Indian Americans were under 181.
That is the key to reading any comparison. Most of the US-born second generation has not yet reached peak earning years, while the immigrant generation is mostly in its 30s, 40s and 50s. Large-scale Indian immigration only took off after 1965, and the immigrant population tripled between 2000 and 20244, so the second generation is still young.
What HeyAlbert data shows
What the income numbers show
Three sources give consistent answers on immigrant households:
- Pew (2023): households headed by an Indian immigrant had a median income of $156,000; those headed by a US-born Indian American, $120,2001.
- Census Bureau (2024): households headed by someone born in India had a median income of $176,169, and per capita income of $96,1142.
- Migration Policy Institute (2024): Indian immigrant-led households had a median of $176,200, compared with $82,400 for all immigrant-led households and $81,400 for households led by the US-born4.
So both Indian American groups earn far more than the US median. The immigrant edge over the US-born is real in the raw data, but it compares people in their 40s with people in their 20s and early 30s. We look at the overall figure in Indian American median household income.
Education: almost no difference
If immigrants' advantage were mainly about skills, it would show in education. It does not. Pew found 77% of Indian immigrants aged 25 and over and 76% of US-born Indian Americans held a bachelor's degree or more1. Among people born in India, the Census Bureau's 2024 figures were 81.8% with a bachelor's degree or higher and 49.7% with a graduate or professional degree2. The second generation has kept the educational profile of the first; see Indian American education levels.
Work and per-person income among India-born residents
The Census Bureau's 2024 profile of people born in India shows how concentrated the immigrant generation is in professional work. Of those aged 16 and over, 74.4% were in the labor force, and 78.8% of those employed worked in management, business, science and arts occupations; 30.2% worked in professional, scientific and management services2. Per capita income for India-born residents was $96,114, compared with $76,212 for all Asian Indians2,3. The gap mainly reflects children: per capita figures divide income by every person, and the broader Asian Indian population includes about 1.1 million people under 18, most of them US-born3.
Other differences
| Measure (Pew, 2021–23 data) | Immigrant | US-born |
|---|---|---|
| Median household income (household head), 2023 | $156,000 | $120,200 |
| Bachelor's degree or more (25+) | 77% | 76% |
| Married (18+) | 77% | 35% |
| Homeownership (household head) | 63% | 54% |
| Living in poverty | 6% | 6% |
| English proficient (5+) | 79% | 96% |
Source: Pew Research Center1. Marriage and homeownership track age closely, which again points to life stage. Many US-born adults are single and renting in their 20s; many immigrants are married homeowners in mid-career. Poverty rates are identical. For more on how earnings change across generations, see do second-generation Indian Americans earn more than their parents.
What about wealth?
No public survey reports net worth separately for immigrant and US-born Indian Americans. Wealth usually rises with age, so on current demographics immigrant households almost certainly hold more of the community's wealth. That may shift as assets pass between generations, a topic we cover in the coming Indian American wealth transfer. For what is known about net worth overall, see Indian American household net worth.
Recent arrivals change the averages
The immigrant group itself is not uniform. Among people born in India and living in the US in 2024, 51.9% had arrived in 2010 or later, and 53% were not yet US citizens2. Pew found that among Indian immigrants in the highest-earning households, 71% had lived in the US for more than 10 years, compared with 53% of those in the lowest-earning households5. Time in the country, like age, is closely tied to income. The visa routes that brought many of these arrivals are covered in the H-1B visa and Indian American wealth.
Frequently asked questions
Do Indian immigrants earn more than US-born Indian Americans?
In raw terms, yes. Pew found a median household income of $156,000 for immigrant-headed Indian households in 2023, versus $120,200 for US-born-headed ones. Much of that gap reflects age, since US-born Indian Americans are far younger on average.
What share of Indian Americans are immigrants?
About 69% of people identifying as Asian Indian alone were born abroad in 2024, according to the Census Bureau. Pew puts the immigrant share at 66% for the broader Indian alone or in combination population.
Are US-born Indian Americans as educated as immigrants?
Yes. Pew found 76% of US-born Indian Americans aged 25 and older held at least a bachelor's degree, compared with 77% of immigrants.
Is there data comparing the two groups at the same age?
Public summary tables do not compare them at matched ages, so the gap in headline income figures should not be read as a like-for-like comparison.
Sources
Figures are from the public sources below, with the data year stated. Estimates are labeled as estimates. Accessed October 24, 2026.
- Pew Research Center, Facts about Indians in the U.S. (2025). pewresearch.org ↩ ↩ ↩
- U.S. Census Bureau, Selected Population Profile in the United States (S0201): Place of birth India, 2024 ACS 1-year estimates (2025). data.census.gov ↩ ↩ ↩
- U.S. Census Bureau, Selected Population Profile in the United States (S0201): Asian Indian alone, 2024 ACS 1-year estimates (2025). data.census.gov ↩ ↩ ↩
- Migration Policy Institute, Indian Immigrants in the United States (2026). migrationpolicy.org ↩ ↩
- Pew Research Center, Income inequality is greater among Chinese Americans than any other Asian origin group in the U.S. (2024). pewresearch.org ↩