
Short answer
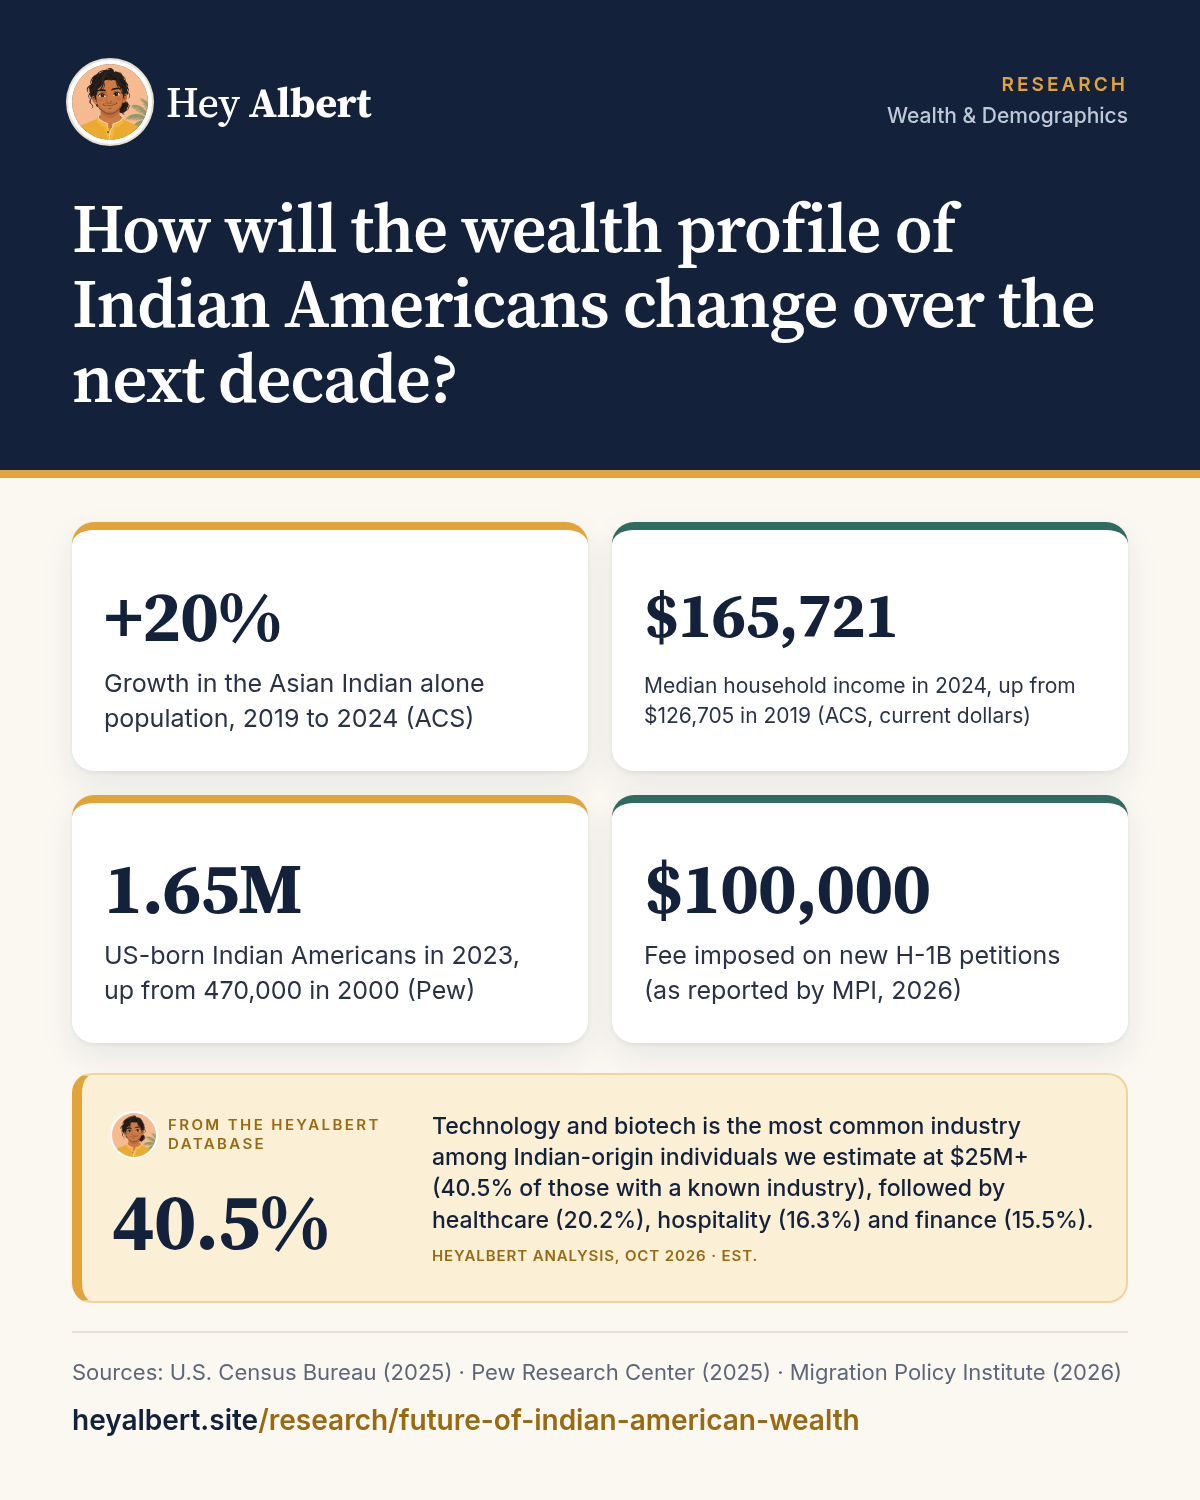
Four trends are likely to shape the next decade, though none can be forecast precisely. The population is growing fast (Asian Indian alone rose from about 4.24 million in 2019 to 5.09 million in 2024)1,2; a large US-born generation, most of it still under 18, will enter the workforce3; immigrants who arrived since 2000 will move toward retirement and begin passing on wealth1; and new immigration rules, including a $100,000 fee on new H-1B petitions, may slow the inflow of new high earners4.
HeyAlbert data shows technology and biotech is the most common industry among Indian-origin individuals we estimate at $25M+ (40.5% of those with a known industry), followed by healthcare (20.2%), hospitality (16.3%) and finance (15.5%). See the data · Methodology
Where things stand
Indian Americans enter the late 2020s as the highest-earning major group in the US. The median Asian Indian household income was $165,721 in 2024, up from $126,705 in 2019 in current dollars, and 78.8% of adults held a bachelor's degree or higher1,2. The community is young (median age 36.1) and mostly foreign-born (69%)1. See Indian American median household income for the baseline. What follows are trends, not forecasts.
What HeyAlbert data shows
1. Continued population growth, but less certain
The population has grown quickly for decades. Pew counted 1.78 million people of Indian origin in 2000 and 4.86 million in its 2021–23 data3, and the Census Bureau's Asian Indian alone count rose about 20% between 2019 and 2024 alone1,2. Pew now counts Indian Americans as the second-largest Asian origin group, at 5.2 million6.
Whether that pace continues depends on immigration policy. The Migration Policy Institute reports that Indian nationals have been particularly affected by tightened policies, including a $100,000 fee for new H-1B petitions, enhanced vetting for H-1B and dependent visa applicants and international students, and longer waits for visa interviews4. Indian nationals received 71% of H-1B visas in fiscal 20244, so changes to that program matter more for this community than for any other. See the H-1B visa and Indian American wealth.
2. The rise of the US-born generation
The second generation is large and young. Pew counted 1.65 million US-born Indian Americans in 2023, up from 470,000 in 2000; their median age was 13.4 and six in ten were under 183. Over the next decade, hundreds of thousands will finish university and start careers. Their education levels already match their parents' (76% of US-born adults have a bachelor's degree, versus 77% of immigrants)3, and research on immigrant families finds children of Indian immigrants climbing above children of US-born parents from the same starting point7. We look at this group in second-generation Indian American income.
3. A shifting map
Growth is uneven across the country, which will shape where new wealth concentrates. Between 2019 and 2024, the Asian Indian alone population grew about 53% in North Carolina (to 161,417), 48% in Washington (to 187,700), 38% in Texas (to 668,034) and 29% in Georgia (to 196,591), compared with about 19% in California and 17% in New Jersey, and roughly 2% in New York10,11. California remains by far the largest home, with about 971,000 Asian Indians10, but Texas, the Southeast and the Pacific Northwest are gaining ground. Lower costs, job growth in technology and health care, and in some states the absence of a state income tax are among the explanations commonly offered, though the data itself does not tell us why people moved. See the states with the most Indian Americans and whether Indian Americans are moving for tax reasons.
4. Aging, retirement and the first big transfers
Only 9.3% of Asian Indians were 65 or older in 2024, against 18.0% of all Americans1,9. That will change gradually: 50.2% of Asian Indian immigrants arrived in 2010 or later and another 22.0% in 2000–20091, so the cohort that drove the community's income gains will be moving through its 50s and 60s. Retirement drawdowns, estate planning and inheritances will become more prominent, many of them crossing the US–India border. Nationally, Cerulli projects $124 trillion in wealth will change hands through 20485. See the coming wealth transfer in Indian American families.
5. From high income to accumulated wealth
Indian Americans' advantage today is clearest in income. Wealth takes time to build, and much of the community's earning power arrived in the last 25 years. If incomes stay high, savings, home equity and investment returns should keep compounding, narrowing the gap between income rank and wealth rank. That is a projection based on how wealth typically builds over a working life, not a measured trend. Equity compensation in technology and the founding of new companies are likely to remain important engines; see Indian American tech founders and unicorns.
Risks and uncertainties
Several factors could change the picture: immigration policy, which affects both new arrivals and those already on temporary visas; the technology cycle, given the community's concentration in professional, scientific and technical work (27.3% of employed Asian Indians in 2024)1; housing costs in the metros where many live; and inequality within the community, which Pew found has risen since 19808. For the full spread of outcomes today, see income distribution among Indian Americans.
Frequently asked questions
Will Indian Americans remain the highest-earning group?
No one can say for certain, but the drivers of today's high incomes, very high education levels and concentration in well-paid professions, are shared by the US-born generation now entering the workforce.
How fast is the Indian American population growing?
The Asian Indian alone population grew about 20 percent between 2019 and 2024, from about 4.24 million to 5.09 million, according to Census Bureau data.
How could immigration policy affect Indian American wealth?
Indian nationals receive most H-1B visas, so new fees and tighter vetting could slow the arrival of new high earners, while having less effect on families already established in the US.
When will large Indian American wealth transfers happen?
Mostly over the next two to three decades, as the large cohort of immigrants who arrived after 2000 reaches retirement age.
Sources
Figures are from the public sources below, with the data year stated. Estimates are labeled as estimates. Accessed October 24, 2026.
- U.S. Census Bureau, Selected Population Profile in the United States (S0201): Asian Indian alone, 2024 ACS 1-year estimates (2025). data.census.gov ↩ ↩ ↩
- U.S. Census Bureau, Selected Population Profile in the United States (S0201): Asian Indian alone, 2019 ACS 1-year estimates (2020). data.census.gov ↩ ↩ ↩
- Pew Research Center, Facts about Indians in the U.S. (2025). pewresearch.org ↩ ↩ ↩
- Migration Policy Institute, Indian Immigrants in the United States (2026). migrationpolicy.org ↩ ↩ ↩
- Cerulli Associates, Cerulli Anticipates $124 Trillion in Wealth Will Transfer Through 2048 (2024). cerulli.com ↩ ↩
- Pew Research Center, Key facts about Asian Americans (2025). pewresearch.org ↩
- National Bureau of Economic Research, Intergenerational Mobility of Immigrants in the US over Two Centuries (NBER Working Paper 26408) (2019). nber.org ↩
- Pew Research Center, Income inequality is greater among Chinese Americans than any other Asian origin group in the U.S. (2024). pewresearch.org ↩
- U.S. Census Bureau, Selected Population Profile in the United States (S0201): Total population, 2024 ACS 1-year estimates (2025). data.census.gov ↩
- U.S. Census Bureau, Selected Population Profile (S0201): Asian Indian alone, by state, 2024 ACS 1-year estimates (2025). data.census.gov ↩ ↩
- U.S. Census Bureau, Selected Population Profile (S0201): Asian Indian alone, by state, 2019 ACS 1-year estimates (2020). data.census.gov ↩