
Short answer
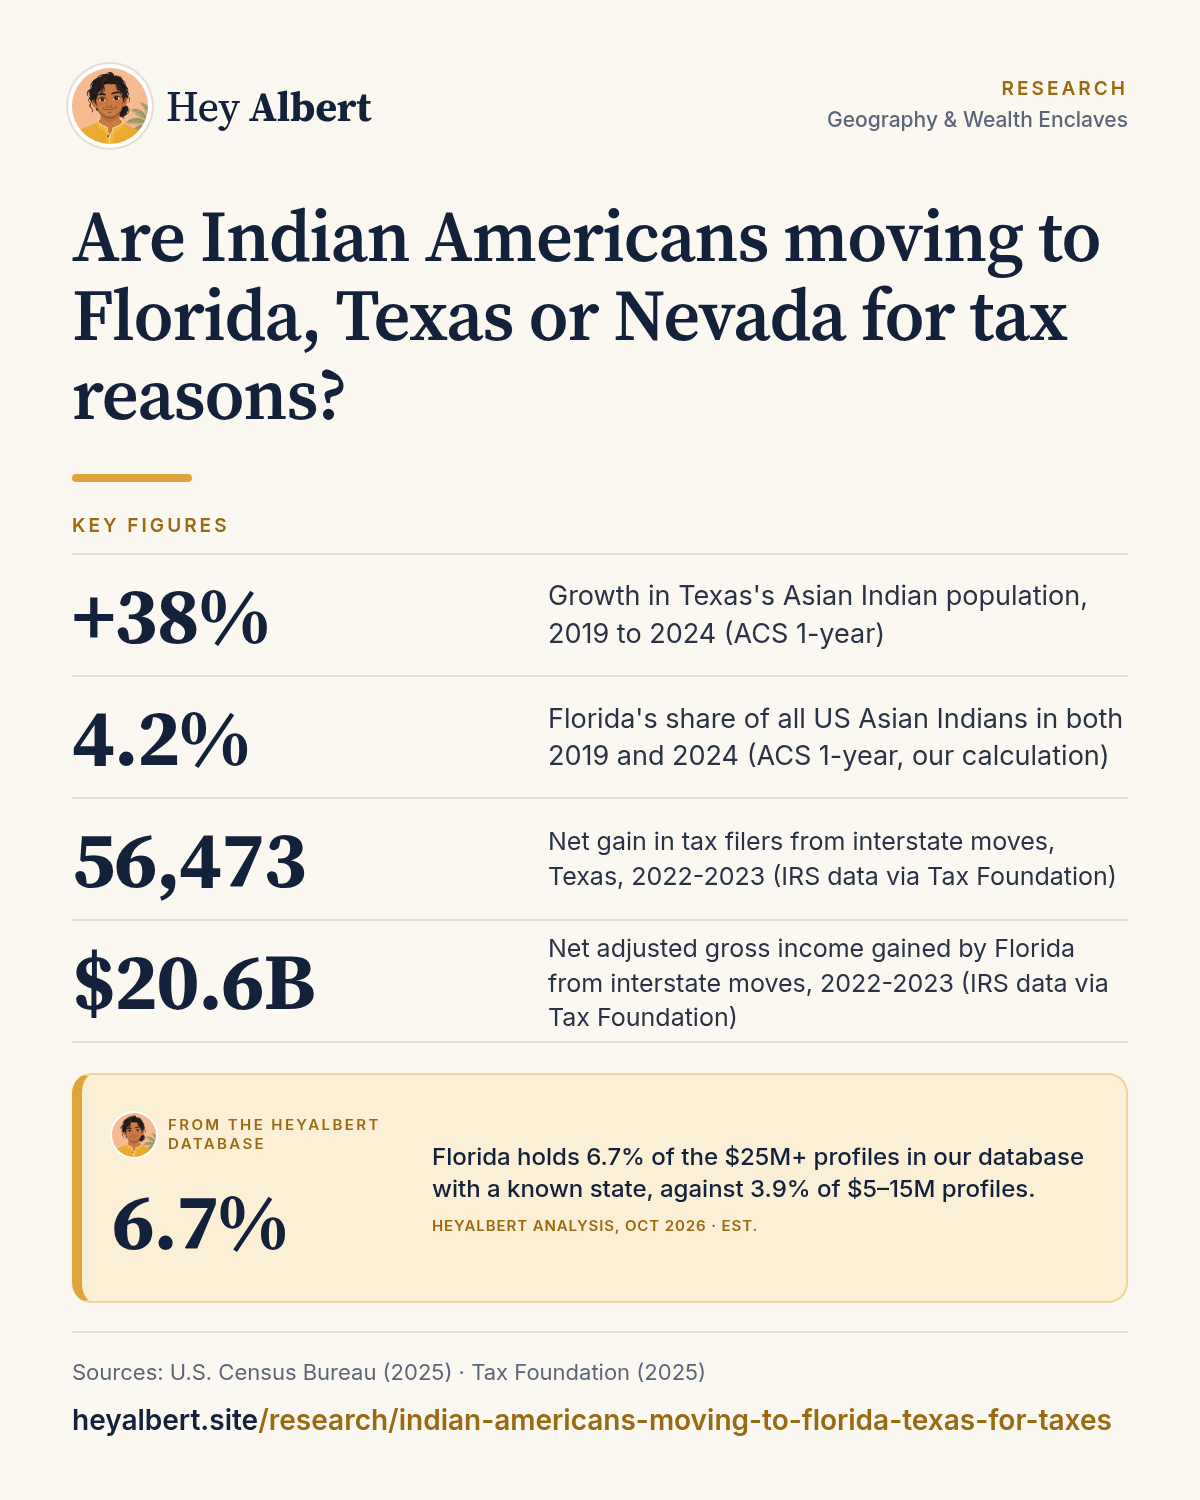
The evidence points to Texas, not Florida or Nevada. Texas's Asian Indian population grew about 38% between 2019 and 2024, raising its share of all US Asian Indians from 11.4% to 13.1%, while Florida's grew about 21%, roughly the national pace, leaving its share flat at 4.2% (our calculations from ACS data)1,2. No public data set tracks moves by Indian Americans specifically for tax reasons, so taxes can be inferred only as one factor alongside jobs and housing.
HeyAlbert data shows Florida holds 6.7% of the $25M+ profiles in our database with a known state, against 3.9% of $5–15M profiles. See the data · Methodology
What the population data show
Census data cannot show why people move, but they show where the Asian Indian population is growing relative to the country. Between 2019 and 2024, the national Asian Indian alone population grew about 20%, from 4,240,466 to 5,094,694, according to ACS 1-year estimates1,2. Against that baseline1,2:
| State | Share of US Asian Indians, 2019 | Share, 2024 | Growth 2019-2024 |
|---|---|---|---|
| Texas | 11.4% | 13.1% | +38% |
| Washington | 3.0% | 3.7% | +48% |
| North Carolina | 2.5% | 3.2% | +53% |
| Florida | 4.2% | 4.2% | +21% |
| California | 19.3% | 19.1% | +19% |
| New Jersey | 9.1% | 8.8% | +17% |
| New York | 8.8% | 7.5% | +2% |
Shares and growth rates are our calculations from ACS 1-year estimates for Asian Indian alone1,2.
Texas and Washington, both without a personal income tax on wages, gained share. So did North Carolina, which has a state income tax. Florida, with no personal income tax, grew at about the national rate. New York lost share. Taxes alone do not explain this pattern; job growth fits it better. See our full state ranking, and for California's flat Los Angeles market, our Southern California profile.
What HeyAlbert data shows
The tax backdrop
Florida's constitution bars the state from levying an income tax on residents beyond what can be credited against a federal or other state tax, which in practice means no state personal income tax4. Texas also does not have a personal income tax, as the Texas Comptroller notes5. Nevada likewise has none. For high earners in California, New York or New Jersey, the difference can be large, especially on bonuses and stock sales.
Overall migration data show money flowing toward low-tax states. IRS figures analyzed by the Tax Foundation show that between 2022 and 2023 Texas gained a net 56,473 tax filers from other states and Florida 55,349, while California lost 100,397 and New York 71,9873. Florida gained a net $20.6 billion in adjusted gross income and Texas $5.5 billion; California lost $11.9 billion and New York $9.9 billion3. The IRS migration files behind those figures do not record race or ancestry7, so they cannot say how many movers were Indian American.
Why Texas, not Florida
The Asian Indian population follows professional jobs. Nationally, 75.7% of employed Asian Indians work in management, business, science and arts occupations8. Texas's largest metros have added technology, finance and corporate employers, and Dallas-Fort Worth's Asian Indian population grew by roughly half between 2019 and 20249. Texas also offers cheaper housing than the coastal hubs: the median home value for Asian Indian homeowners was $648,500 in Dallas-Fort Worth against $1,785,700 in the San Jose metro9. We cover this in where affluent Indian Americans live in Texas.
Florida's Asian Indian community is smaller and more dispersed, with about 31,200 residents in Broward County, 29,900 in Hillsborough County and 26,300 in Orange County in the 2020-2024 estimates10. Its median Asian Indian household income, $134,318 in 2024, is below the national Asian Indian median of $165,7211,8. Any moves by a small number of very wealthy individuals would not be visible in these population figures.
The other side: New York and New Jersey
The states losing share are the high-tax Northeast states with long-established communities. New York's Asian Indian population was essentially flat between 2019 and 2024, up about 2%, and its share of the national total fell from 8.8% to 7.5%1,2. New Jersey still grew about 17%, slightly below the national pace1,2. Within the New York area, Queens's Asian Indian population declined while suburban counties grew, which looks more like a move to the suburbs than out of the region; we cover that in our New York metro profile and our New Jersey analysis.
A slower-growing population is not the same as people leaving. Some of the difference reflects where new immigrants settle: newer arrivals on work visas tend to go where the employers hiring them are expanding, which in recent years has meant Texas, Washington and the Southeast.
Nevada
Nevada's Asian Indian community is small. The Census Bureau's 2020-2024 five-year estimates count 19,343 Asian Indian residents statewide6, too few for the annual detailed profiles the bureau publishes for larger states. There is no public evidence of a significant Indian American move to Nevada for tax reasons.
Taxes matter most at the top
For most Indian American households, a move is driven by jobs, family and schools. Tax planning matters more for founders and executives with large equity stakes, where the timing of a move relative to a liquidity event can affect state taxes significantly. Rules on residency, sourcing of equity income and departure audits are complex and vary by state, so advisors treat this as specialized planning. We cover related topics in equity compensation for tech executives, the largest Indian American IPOs and exits and Indian American family offices.
Frequently asked questions
Are Indian Americans moving to Texas?
Yes. Texas's Asian Indian population grew about 38% between 2019 and 2024, to about 668,000, and its share of all US Asian Indians rose from 11.4% to 13.1%, based on ACS 1-year estimates.
Are wealthy Indian Americans moving to Florida for taxes?
Census data do not show a broad shift. Florida's Asian Indian population grew at about the national rate between 2019 and 2024, so its share stayed at 4.2%. Individual high-net-worth moves would not show up in these figures.
Does any data track Indian Americans moving for tax reasons?
No. IRS migration data track income moving between states but do not record race or ancestry, and Census data show where people live but not why they moved.
Which states have no personal income tax?
Florida, Texas, Nevada and Washington are among the states with no personal income tax on wages. Washington does tax certain long-term capital gains.
Sources
Figures are from the public sources below, with the data year stated. Estimates are labeled as estimates. Accessed October 24, 2026.
- US Census Bureau, S0201 Selected Population Profile, Asian Indian alone, by state (ACS 2024 1-year) (2025). data.census.gov ↩ ↩ ↩
- US Census Bureau, S0201 Selected Population Profile, Asian Indian alone, by state and US (ACS 2019 1-year) (2020). data.census.gov ↩ ↩ ↩
- Tax Foundation, State Migration Trends: Americans Moving, Population Changes (IRS data, 2022-2023) (2025). taxfoundation.org ↩ ↩ ↩
- The Florida Senate, Constitution of the State of Florida, Article VII, Section 5 (2026). flsenate.gov ↩
- Texas Comptroller of Public Accounts, Starting a New Business (Fiscal Notes) (2016). comptroller.texas.gov ↩
- US Census Bureau, B02015 Asian Alone by Selected Groups, Nevada (ACS 2020-2024 5-year) (2025). data.census.gov ↩ ↩
- Internal Revenue Service, SOI Tax Stats – Migration Data 2022–2023 (2025). irs.gov ↩
- US Census Bureau, S0201 Selected Population Profile, Asian Indian alone, United States (ACS 2024 1-year) (2025). data.census.gov ↩ ↩
- US Census Bureau, S0201 Selected Population Profile, Asian Indian alone, by metro area (ACS 2024 1-year) (2025). data.census.gov ↩ ↩
- US Census Bureau, B02015 Asian Alone by Selected Groups, Florida counties (ACS 2020-2024 5-year) (2025). data.census.gov ↩