
Short answer
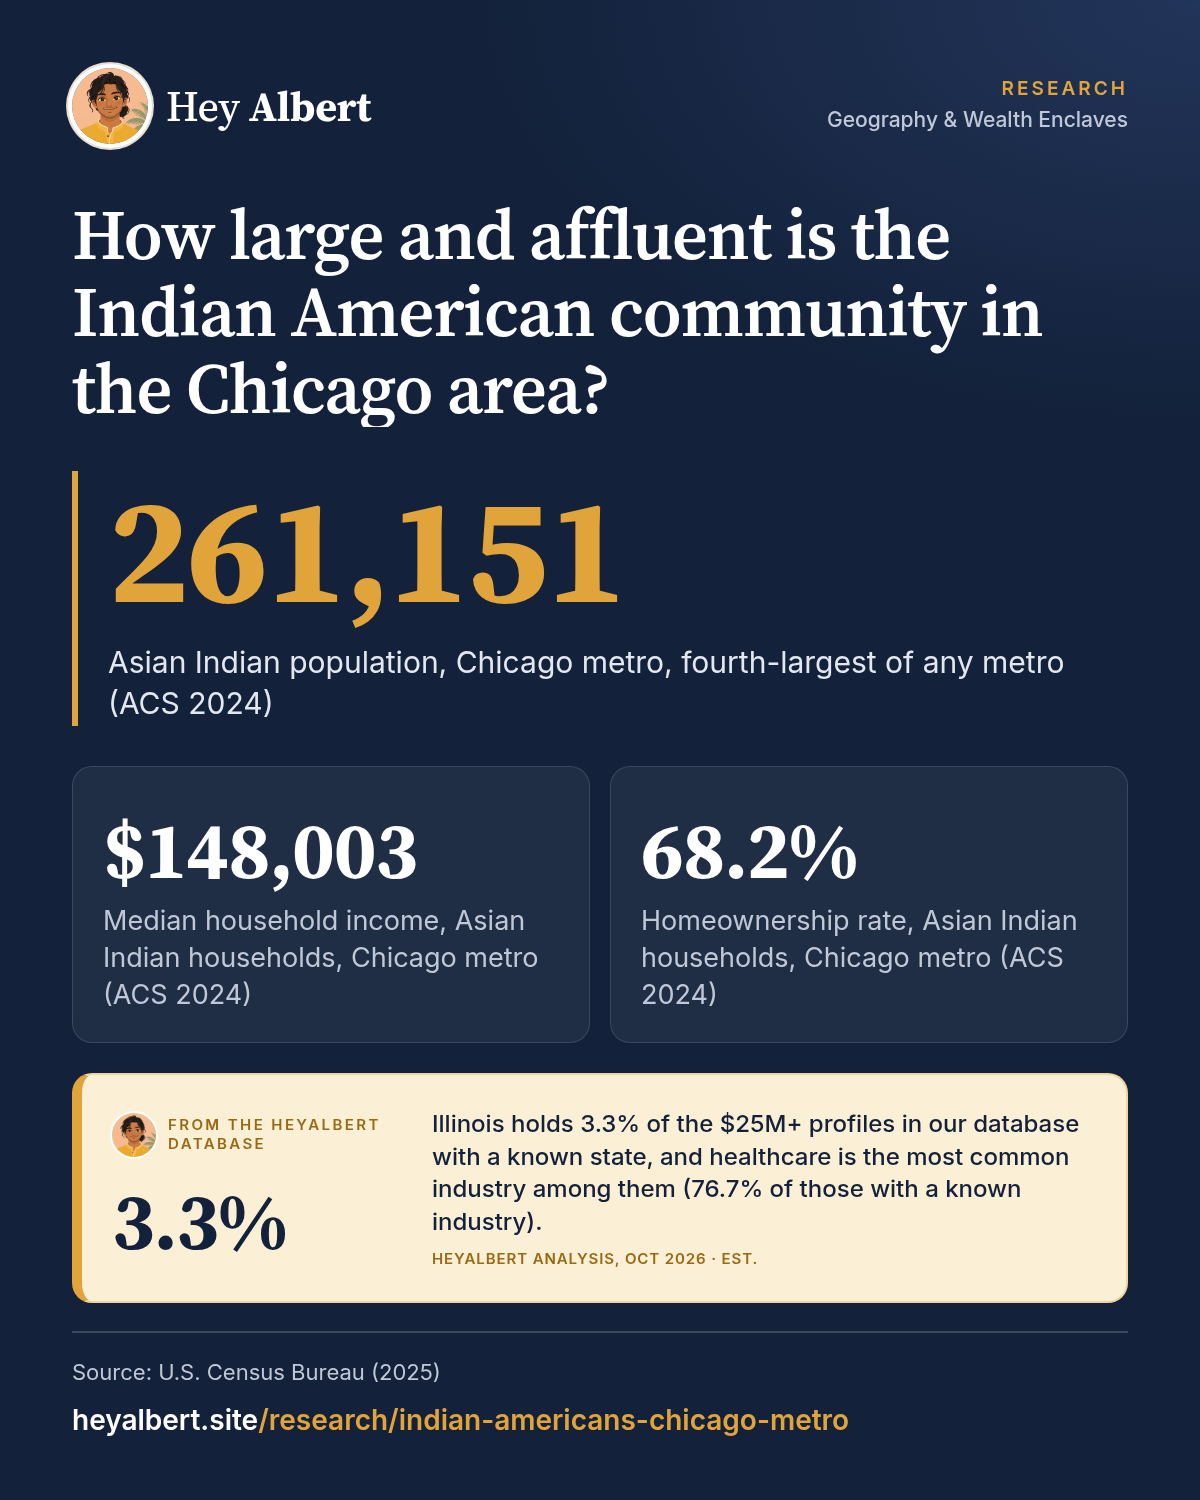
The Chicago metro area had 261,151 Asian Indian residents in 2024, the fourth-largest Indian American metro community in the US, with a median household income of $148,003 against $90,770 for all metro households1,2. The community is mostly suburban: DuPage County, Naperville and Schaumburg have the largest concentrations outside the city, where Asian Indians are 13% or more of some suburbs' populations3,4.
HeyAlbert data shows Illinois holds 3.3% of the $25M+ profiles in our database with a known state, and healthcare is the most common industry among them (76.7% of those with a known industry). See the data · Methodology
Size: the Midwest's largest Indian American community
With 261,151 Asian Indian residents in 2024, the Chicago-Naperville-Elgin metro ranks fourth nationally, after New York, Dallas-Fort Worth and San Francisco1. Asian Indians are 2.8% of the metro's population1,2. The Migration Policy Institute (MPI) lists Chicago among the five metros where about 35% of all Indian immigrants live, in pooled 2020-24 data5. Statewide, Illinois had 282,471 Asian Indian residents, fifth among states6.
The metro's Asian Indian population grew from about 224,700 in 2019 to about 261,200 in 2024, roughly 16%, our calculation from ACS 1-year estimates; the metro's boundaries changed slightly over that period1,7. See how Chicago ranks in our metro comparison and how Illinois compares in our state ranking.
What HeyAlbert data shows
Income and wealth indicators
The median Asian Indian household in the Chicago metro earned $148,003 in 2024, about 63% more than the metro-wide median of $90,7701,2. That is below the national Asian Indian median of $165,7218, and well below the coastal tech hubs, but Chicago's lower housing costs change the picture. The median home value for Asian Indian homeowners was $482,700, against $1,785,700 in the San Jose metro and $738,600 in the New York metro, and the homeownership rate was 68.2%, higher than in either1.
Education levels are high: 77.6% of Asian Indian adults 25 and older hold at least a bachelor's degree and 41.8% a graduate or professional degree1. The poverty rate was 7.3%1. Our national analysis of Indian American household income puts these figures in context.
Where the community lives
Most of the region's Asian Indian residents live outside the city. The Census Bureau's 2020-2024 five-year estimates count about 122,700 in Cook County, 57,300 in DuPage County (6.2% of the county), 26,500 in Lake County and 20,400 in Will County3. At the city and village level4:
| Place | Asian Indian residents | Share of population |
|---|---|---|
| Chicago | 47,034 | 1.7% |
| Naperville | 20,365 | 13.5% |
| Aurora | 11,873 | 6.6% |
| Schaumburg | 10,151 | 13.2% |
| Buffalo Grove | 7,523 | 17.5% |
| Hoffman Estates | 6,269 | 12.3% |
Shares are our calculation against total population; estimates carry margins of error of several hundred to about 3,200 people4.
County incomes: the outer suburbs lead
The most recent detailed county income figures for Asian Indian households come from the Census Bureau's 2017-2021 five-year Selected Population Tables. In the Chicago area they show Will County at $170,927, Kane County at $168,391, Lake County at $143,458, DuPage County at $132,336 and Cook County at $115,819 (in 2021 dollars)9. Smaller counties have wide margins of error. More recent 2024 data for Cook County show an Asian Indian median household income of $129,501, against $82,764 for all Cook County households10.
What the community does
Chicago's Asian Indian workforce is spread across sectors more evenly than in the tech hubs. In the metro, 24.2% of employed Asian Indians work in professional, scientific and management services, 22.6% in education and health care and 12.3% in finance, insurance and real estate, while only 2.1% work in the information sector1. In Cook County, 27.0% work in education and health care10. Health care, consulting and finance are all large employers in the region; see Indian American physicians and Indian Americans in management consulting.
The community also has a long entrepreneurial history, from retail and hospitality to real estate. See Indian American small business ownership.
An established immigrant community, and a Midwest peer
About two-thirds of the metro's Asian Indian residents, 176,099 of 261,151, were born abroad, close to the national Asian Indian share1,8. Households average 2.76 people, smaller than in central New Jersey or Long Island1. Many families have been in the region for decades, and a growing US-born second generation is entering the workforce, a shift we examine in how foreign-born and US-born Indian Americans compare.
Chicago's closest regional peer is Detroit, where the metro's 119,044 Asian Indian residents had a median household income of $144,079 in 2024, and grew roughly 32% from 2019, faster than Chicago over the same period1,7. Together the two metros anchor the Midwest's Indian American population, with workforces concentrated in professional services and health care1.
Why it matters
Chicago's Indian American market looks different from the coasts: high incomes, high homeownership and moderate housing costs, which can leave more room for saving and investing. It is also older and more established than fast-growing hubs such as Dallas or Seattle, with a median age of 37.91. For how that translates into wealth over time, see saving and investing habits among Indian Americans.
An established, high-earning community also carries civic weight; for how Indian Americans take part in politics as voters, candidates and donors, see Indian American political giving.
Frequently asked questions
How many Indian Americans live in the Chicago area?
About 261,000 people identified as Asian Indian alone in the Chicago-Naperville-Elgin metro area in 2024, the fourth-largest such community among US metros.
Which Chicago suburbs have the most Indian Americans?
Naperville has about 20,400 Asian Indian residents, 13.5% of the city, and Schaumburg about 10,200, 13.2%. Buffalo Grove has the highest share among larger suburbs at 17.5%, according to 2020-2024 Census estimates.
What is the median income of Indian Americans in Chicago?
About $148,000 for Asian Indian households in the Chicago metro in 2024, compared with about $91,000 for all metro households.
Is the Chicago Indian American community growing?
Yes, more slowly than in the Sun Belt. ACS 1-year estimates show growth of roughly 16% between 2019 and 2024.
Sources
Figures are from the public sources below, with the data year stated. Estimates are labeled as estimates. Accessed October 24, 2026.
- US Census Bureau, S0201 Selected Population Profile, Asian Indian alone, by metro area (ACS 2024 1-year) (2025). data.census.gov ↩ ↩ ↩
- US Census Bureau, S0201 Selected Population Profile, total population, by metro area (ACS 2024 1-year) (2025). data.census.gov ↩ ↩ ↩
- US Census Bureau, B02015 Asian Alone by Selected Groups, Illinois counties (ACS 2020-2024 5-year) (2025). data.census.gov ↩ ↩
- US Census Bureau, B02015 Asian Alone by Selected Groups and B01003 Total Population, Illinois places (ACS 2020-2024 5-year) (2025). data.census.gov ↩ ↩ ↩
- Migration Policy Institute, Indian Immigrants in the United States (2026). migrationpolicy.org ↩
- US Census Bureau, S0201 Selected Population Profile, Asian Indian alone, by state (ACS 2024 1-year) (2025). data.census.gov ↩
- US Census Bureau, S0201 Selected Population Profile, Asian Indian alone, by metro area (ACS 2019 1-year) (2020). data.census.gov ↩ ↩
- US Census Bureau, S0201 Selected Population Profile, Asian Indian alone, United States (ACS 2024 1-year) (2025). data.census.gov ↩ ↩
- US Census Bureau, B19013 Median Household Income, Asian Indian alone, Illinois counties (ACS 2017-2021 5-year Selected Population Tables) (2023). data.census.gov ↩
- US Census Bureau, S0201 Selected Population Profile, Asian Indian alone and total population, by county (ACS 2024 1-year) (2025). data.census.gov ↩ ↩