
Short answer
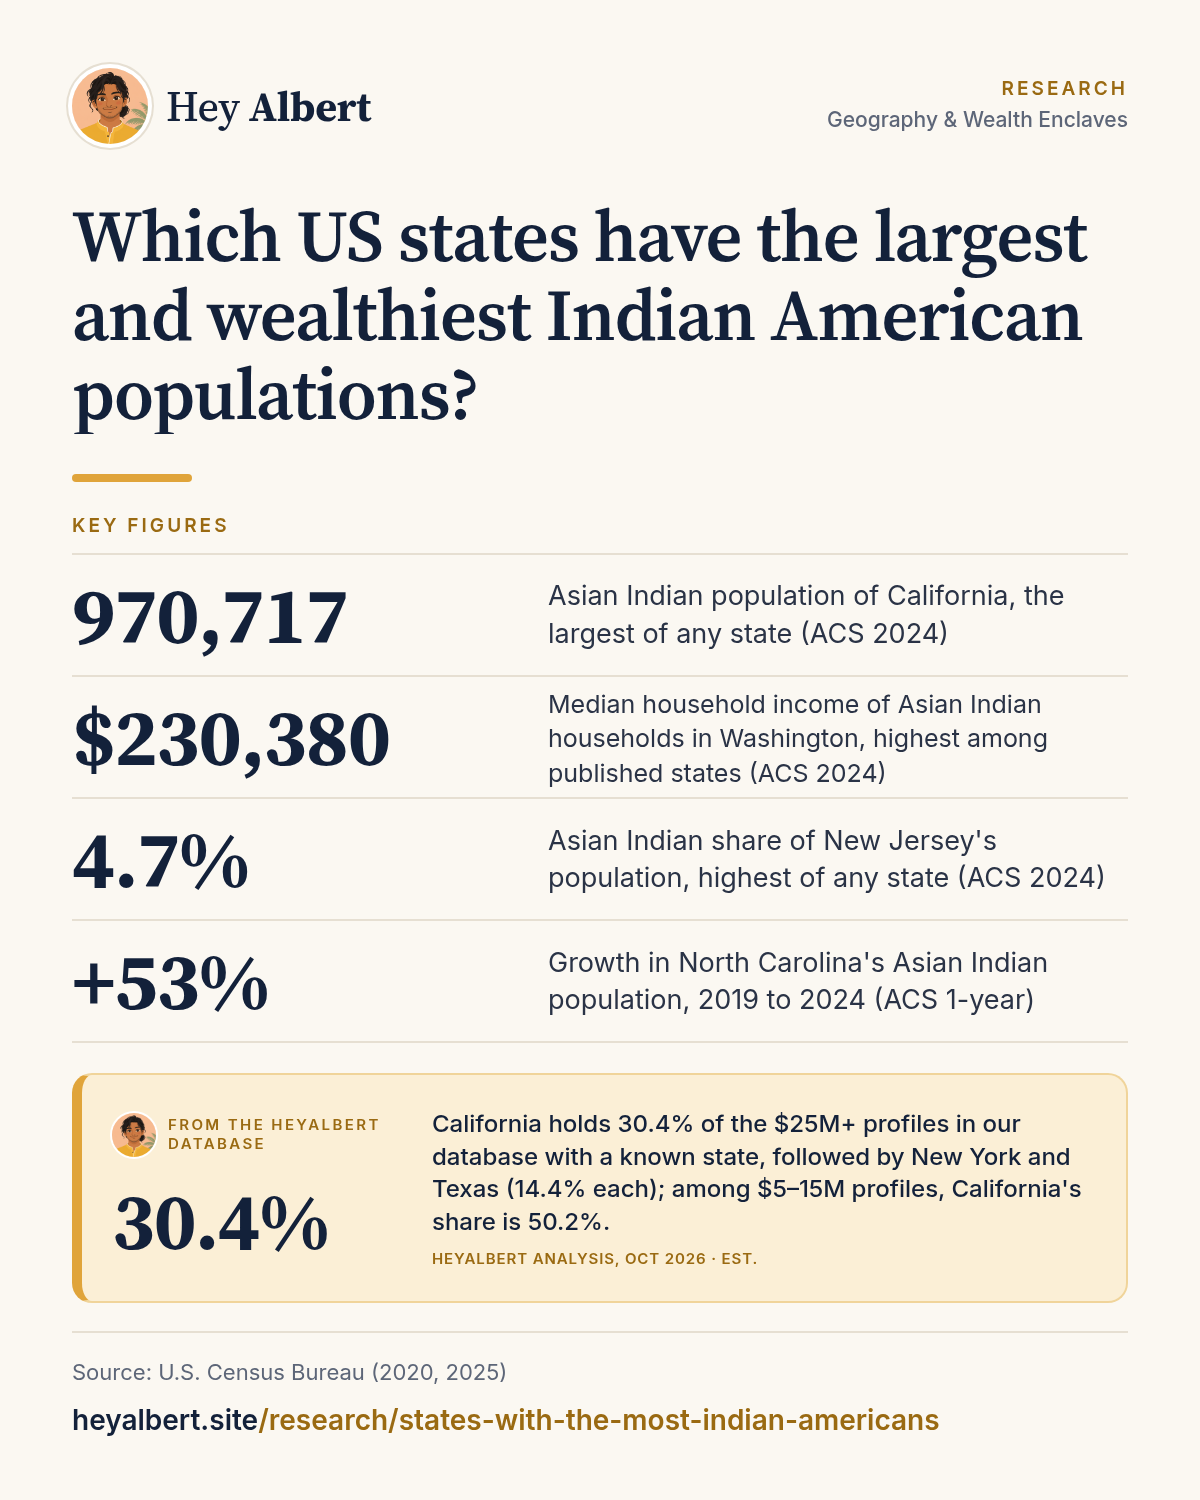
California has the largest Asian Indian population in the US, about 971,000 people in 2024, followed by Texas (668,000) and New Jersey (449,000), according to the Census Bureau's American Community Survey1. By median household income, the most affluent Indian American communities are in Washington ($230,380), California ($212,558) and Massachusetts ($200,787)1. New Jersey has the highest concentration, with Asian Indians making up 4.7% of the state's population1,2.
HeyAlbert data shows California holds 30.4% of the $25M+ profiles in our database with a known state, followed by New York and Texas (14.4% each); among $5–15M profiles, California's share is 50.2%. See the data · Methodology
The largest Indian American populations by state
About 5.09 million people in the US identified as Asian Indian alone in 2024, and about 5.56 million as Asian Indian alone or in combination with another group, according to the American Community Survey (ACS)4. The population is concentrated: California, Texas and New Jersey together account for about 2.1 million of the 5.09 million1,4.
- California: 970,717 people, 2.5% of the state1,2
- Texas: 668,034, 2.1%1,2
- New Jersey: 448,588, 4.7%1,2
- New York: 380,742, 1.9%1,2
- Illinois: 282,471, 2.2%1,2
These are ACS 2024 1-year estimates, the latest available as of October 2026. They carry margins of error, so small differences between states should not be over-read. For the national picture, see our analysis of Indian American median household income.
One definitional note: this analysis uses the "Asian Indian alone" group, people who report Asian Indian as their only race. Counting people who report Asian Indian together with another race adds roughly 465,000 people nationally4, so state totals on that broader basis run somewhat higher.
What HeyAlbert data shows
Where Indian American households earn the most
Asian Indian households out-earn the overall population in every state the Census Bureau publishes. Nationally, their median household income was $165,721 in 2024, compared with $81,604 for all US households4. The gap is widest where technology employment is concentrated:
- Washington: $230,380, against $99,389 for all households in the state1,2
- California: $212,558, against $100,1491,2
- Massachusetts: $200,787, against $104,8281,2
- New Jersey: $188,317, against $104,2941,2
- Virginia: $185,560, against $92,0901,2
Washington's figure reflects the Seattle area's tech employers, which we cover in why Seattle has become a center of Indian American tech wealth. California's reflects the Bay Area, where Asian Indian household income in the San Jose and San Francisco metros exceeds the Census Bureau's top reporting band of $250,0005. See our Silicon Valley analysis; Southern California, by contrast, has a larger but more dispersed community, covered in our SoCal profile.
State-by-state table
| State | Asian Indian population | Share of state | Median household income, Asian Indian households | Median household income, all households |
|---|---|---|---|---|
| California | 970,717 | 2.5% | $212,558 | $100,149 |
| Texas | 668,034 | 2.1% | $167,991 | $79,721 |
| New Jersey | 448,588 | 4.7% | $188,317 | $104,294 |
| New York | 380,742 | 1.9% | $124,215 | $85,820 |
| Illinois | 282,471 | 2.2% | $142,116 | $83,211 |
| Florida | 215,918 | 0.9% | $134,318 | $77,735 |
| Georgia | 196,591 | 1.8% | $165,100 | $79,991 |
| Washington | 187,700 | 2.4% | $230,380 | $99,389 |
| Virginia | 174,137 | 2.0% | $185,560 | $92,090 |
| Pennsylvania | 169,415 | 1.3% | $161,560 | $77,545 |
| North Carolina | 161,417 | 1.5% | $178,169 | $73,958 |
| Michigan | 148,509 | 1.5% | $135,624 | $72,389 |
| Massachusetts | 142,759 | 2.0% | $200,787 | $104,828 |
| Ohio | 111,815 | 0.9% | $123,404 | $72,212 |
| Maryland | 109,438 | 1.7% | $181,533 | $102,905 |
| Arizona | 78,256 | 1.0% | $135,740 | $81,486 |
| Connecticut | 65,274 | 1.8% | $144,423 | $96,049 |
Source: ACS 2024 1-year Selected Population Profiles, Asian Indian alone1,2. Only states meeting the Census Bureau's publication threshold appear.
Concentration: New Jersey stands out
Size and concentration are different measures. California has the most Asian Indian residents, but they are 2.5% of its population. In New Jersey the share is 4.7%, the highest of any state1,2. At the county level the pattern is sharper: Asian Indians were 16.9% of Middlesex County, New Jersey's population in 20246. We explain how that came about in why New Jersey, and Middlesex County in particular, became a hub.
The fastest-growing states
Comparing the ACS 1-year estimates for 2019 and 2024 shows where the population is growing fastest1,3:
- North Carolina: from 105,637 to 161,417, up 53%
- Washington: from 127,139 to 187,700, up 48%
- Texas: from 483,245 to 668,034, up 38%
- Georgia: from 152,164 to 196,591, up 29%
By contrast, New York (up 2%) and Maryland (up 2%) were roughly flat over the same period1,3. Texas added more Asian Indian residents than any other state, about 185,000, and is on track to narrow the gap with California. Our post on Indian Americans in Dallas, Houston and Austin looks at where that growth is landing, and our piece on whether taxes are driving moves to Texas and Florida weighs the evidence.
What drives the map
The geography follows employment. Asian Indian workers are heavily concentrated in professional and technical work: 75.7% of employed Asian Indians worked in management, business, science and arts occupations in 2024, compared with 43.5% of all US workers4. Their states of residence map closely onto the big technology, finance, pharmaceutical and healthcare employment centers. Metro-level data, which we break down in the most affluent Indian American metro areas, make the link even clearer.
State medians also hide wide variation. New York's Asian Indian median household income, $124,215, is well below New Jersey's, partly because the New York figure includes a large, longer-established community in Queens with lower incomes than its suburban counterparts1,6.
Frequently asked questions
Which state has the most Indian Americans?
California, with about 971,000 people who identify as Asian Indian alone, according to the 2024 American Community Survey. Texas is second with about 668,000 and New Jersey third with about 449,000.
Which state has the highest percentage of Indian Americans?
New Jersey. Asian Indians made up 4.7% of the state's population in 2024, the highest share of any state.
Where do the wealthiest Indian Americans live?
By median household income, Washington state leads at about $230,000, followed by California and Massachusetts. Within states, the highest incomes are in the San Jose, San Francisco and Seattle metro areas.
Which states are growing fastest?
Between 2019 and 2024, North Carolina's Asian Indian population grew about 53%, Washington's about 48% and Texas's about 38%, based on ACS 1-year estimates.
Sources
Figures are from the public sources below, with the data year stated. Estimates are labeled as estimates. Accessed October 24, 2026.
- US Census Bureau, S0201 Selected Population Profile, Asian Indian alone, by state (ACS 2024 1-year) (2025). data.census.gov ↩ ↩ ↩
- US Census Bureau, S0201 Selected Population Profile, total population, by state (ACS 2024 1-year) (2025). data.census.gov ↩ ↩ ↩
- US Census Bureau, S0201 Selected Population Profile, Asian Indian alone, by state (ACS 2019 1-year) (2020). data.census.gov ↩ ↩ ↩
- US Census Bureau, S0201 Selected Population Profile, Asian Indian alone and total population, United States (ACS 2024 1-year) (2025). data.census.gov ↩ ↩ ↩
- US Census Bureau, S0201 Selected Population Profile, Asian Indian alone, by metro area (ACS 2024 1-year) (2025). data.census.gov ↩
- US Census Bureau, S0201 Selected Population Profile, Asian Indian alone and total population, by county (ACS 2024 1-year) (2025). data.census.gov ↩ ↩