
Short answer
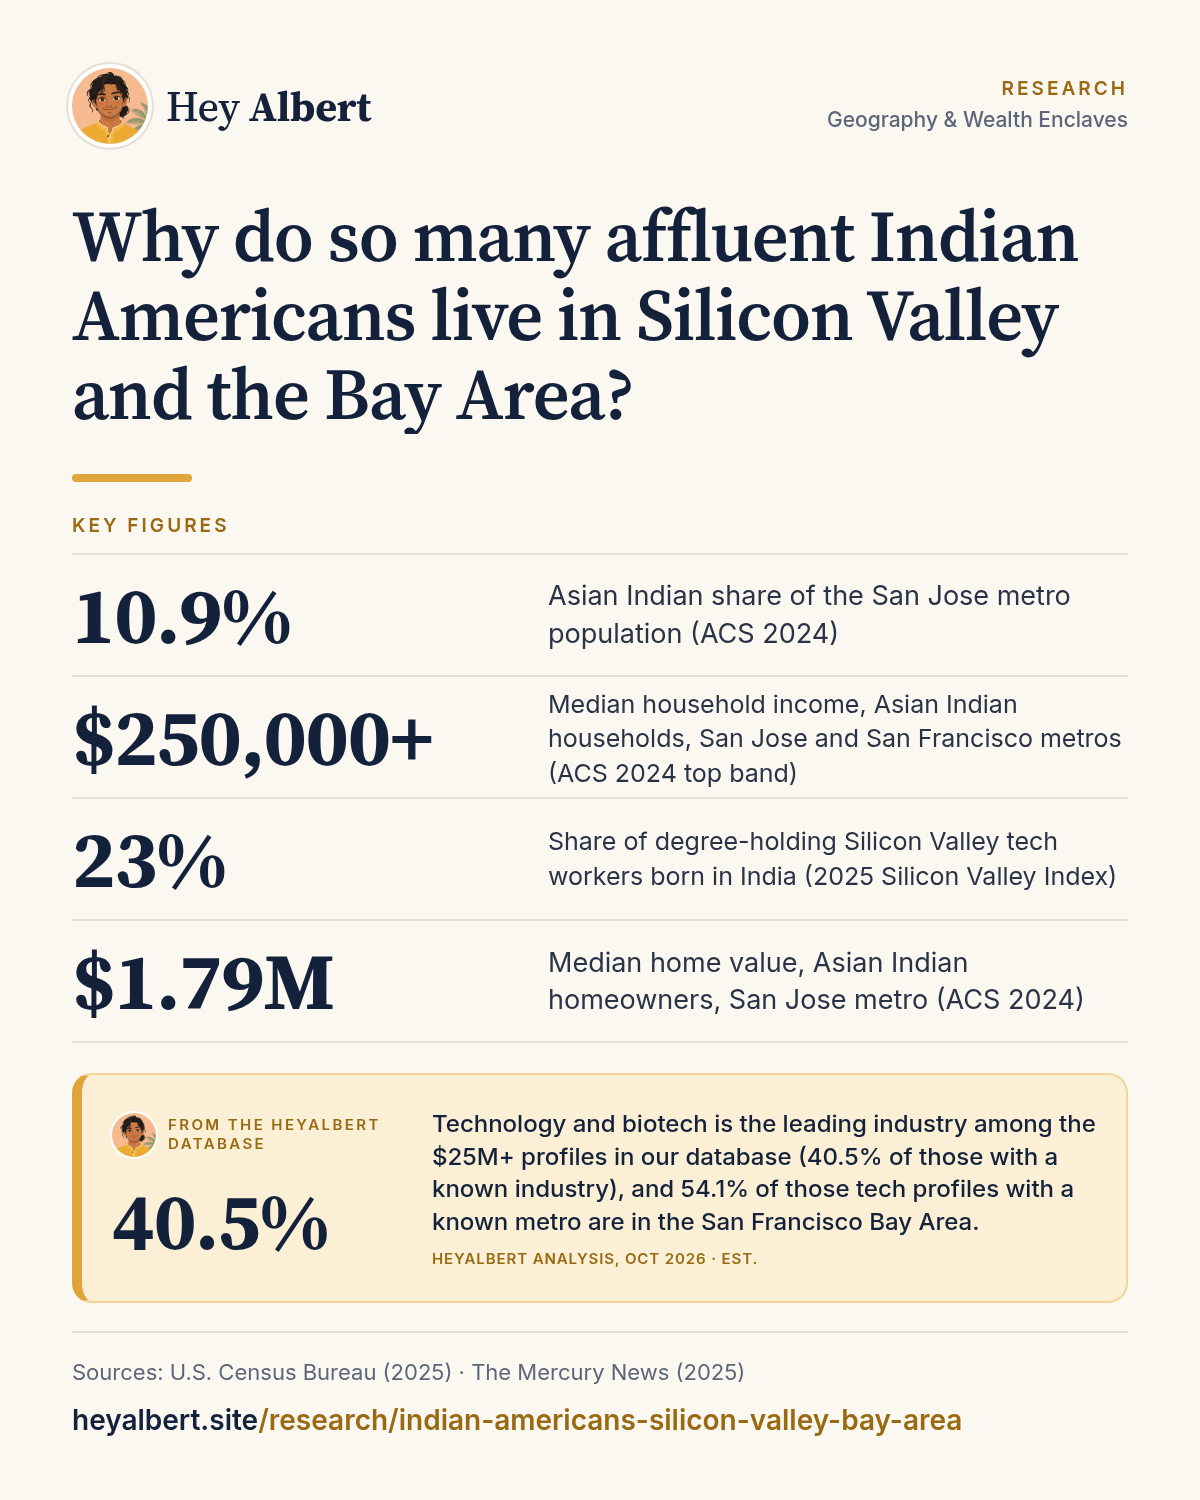
The San Jose and San Francisco metro areas are home to about 482,000 Asian Indian residents, and in both the median Asian Indian household income exceeds $250,000, the Census Bureau's top reporting band (ACS 2024)1. The draw is the region's technology economy: 23% of Silicon Valley tech workers with a bachelor's degree or higher were born in India, according to the 2025 Silicon Valley Index3. Skilled-worker immigration and a deep startup ecosystem have kept that pipeline running for decades.
HeyAlbert data shows technology and biotech is the leading industry among the $25M+ profiles in our database (40.5% of those with a known industry), and 54.1% of those tech profiles with a known metro are in the San Francisco Bay Area. See the data · Methodology
The numbers: the highest Indian American incomes in the country
In 2024 the San Francisco-Oakland-Fremont metro area had 263,786 residents who identified as Asian Indian alone, and the San Jose-Sunnyvale-Santa Clara metro had 218,203, according to the American Community Survey (ACS)1. In the San Jose metro they make up 10.9% of the population, the highest share of any large metro area the Census Bureau publishes1,2.
Their incomes are the highest of any Indian American community in the US. In both metros the median Asian Indian household income is above $250,000, the ceiling the ACS uses for reporting medians, so the true figure is not published1. Other measures show the same thing:
- Per capita income: $125,482 in the San Jose metro and $112,637 in the San Francisco metro, against $76,212 for Asian Indians nationally1,4
- Graduate or professional degrees: held by 60.2% of Asian Indian adults 25 and older in the San Jose metro1
- Median home value: $1,785,700 for Asian Indian homeowners in the San Jose metro and $1,584,300 in the San Francisco metro1
At the county level, Santa Clara County had 217,805 Asian Indian residents (11.3% of the county) and Alameda County 152,772 (9.3%)6. For how the Bay Area compares with other regions, see our ranking of the most affluent Indian American metro areas.
What HeyAlbert data shows
Driver 1: the technology job market
The simplest explanation is employment. In the San Jose metro, 40.4% of employed Asian Indians work in professional, scientific and management services and another 10.6% in the information sector; in the San Francisco metro the figures are 37.4% and 8.1%1. Nationally, the shares for all workers are 12.9% and 1.8%4.
Silicon Valley's tech workforce is heavily foreign-born. The 2025 Silicon Valley Index from Joint Venture Silicon Valley found 66% of the region's technology workers were born abroad, and among tech workers with at least a bachelor's degree, 23% came from India, compared with 17% born in California, as reported by the Mercury News3. We look at why that pattern extends into the executive suite in why so many tech CEOs are Indian American.
Driver 2: skilled-worker immigration
Many Bay Area Indian Americans arrived through employer-sponsored visas. US Citizenship and Immigration Services reports that 70% of H-1B petitions approved in fiscal 2025 were for people born in India, and computer-related occupations accounted for 62% of all approvals7. Because the Bay Area is the country's densest cluster of computing employers, it absorbs a large share of that talent.
Immigration selects for education. Among Asian Indians in the San Jose metro, 73% were born abroad, our calculation from ACS counts (160,175 of 218,203)1. The role of the visa system in building wealth is the subject of our post on H-1B visas and Indian American wealth.
Driver 3: founders, equity and the startup ecosystem
Salaries alone do not explain Bay Area wealth; equity does. A June 2026 analysis by the National Foundation for American Policy (NFAP) found immigrants founded or co-founded 59% of US privately held startups valued at $1 billion or more (455 of 775), and India was the leading country of origin, with 96 companies5. California was home to 268 of the immigrant-founded billion-dollar companies, far more than any other state5.
When those companies are acquired or go public, founders and early employees can turn stock into substantial wealth. We cover this in depth in Indian American tech founders and unicorns and how equity compensation builds wealth for tech executives.
Driver 4: networks that compound
Clusters reinforce themselves. Professional and alumni networks, angel groups and community organizations founded in the Bay Area help newcomers find jobs, co-founders and investors. Our research on TiE, AAPI and other professional networks and on Indian American angel investors looks at how those networks direct capital.
The cost side, and where growth is moving
High incomes come with very high housing costs. The Asian Indian homeownership rate in the San Jose metro is 51.5%, below the national Asian Indian rate of 63.0%1,4, which likely reflects housing prices. Growth has also been slower than in newer hubs. Between 2019 and 2024 the San Jose metro's Asian Indian population grew about 25% and the San Francisco metro's about 12%, our calculation from ACS 1-year estimates, while the Seattle metro's grew about 45% and the Dallas-Fort Worth metro's about 55%1,8. The Bay Area remains the wealthiest Indian American community, but it is no longer where most new growth is happening. See Southern California, where growth has stalled, and the newer hubs of Seattle and Texas for the newer hubs.
Frequently asked questions
How many Indian Americans live in the Bay Area?
About 482,000 people who identify as Asian Indian alone lived in the San Francisco and San Jose metro areas combined in 2024, according to the American Community Survey.
What is the median income of Indian Americans in Silicon Valley?
In both the San Jose and San Francisco metro areas, the median Asian Indian household income is above $250,000, the highest level the Census Bureau reports for medians, so the exact figure is not published.
Which Bay Area county has the most Indian Americans?
Santa Clara County, with about 218,000 Asian Indian residents in 2024, or 11.3% of the county's population. Alameda County is second with about 153,000.
Why did so many Indian immigrants settle in Silicon Valley?
Mainly technology jobs. Employer-sponsored visas, most of which go to people born in India and to computer-related occupations, brought skilled workers to the region's employers, and startup equity and professional networks have reinforced the cluster.
Sources
Figures are from the public sources below, with the data year stated. Estimates are labeled as estimates. Accessed October 24, 2026.
- US Census Bureau, S0201 Selected Population Profile, Asian Indian alone, by metro area (ACS 2024 1-year) (2025). data.census.gov ↩ ↩ ↩
- US Census Bureau, S0201 Selected Population Profile, total population, by metro area (ACS 2024 1-year) (2025). data.census.gov ↩ ↩
- The Mercury News, Two-thirds of Silicon Valley tech workers are foreign-born, report says (Mercury News, via Spokesman-Review) (2025). spokesman.com ↩ ↩ ↩
- US Census Bureau, S0201 Selected Population Profile, Asian Indian alone and total population, United States (ACS 2024 1-year) (2025). data.census.gov ↩ ↩ ↩
- National Foundation for American Policy, Immigrants and U.S. Billion-Dollar Companies (NFAP Policy Brief, June 2026) (2026). nfap.com ↩ ↩ ↩
- US Census Bureau, S0201 Selected Population Profile, Asian Indian alone and total population, by county (ACS 2024 1-year) (2025). data.census.gov ↩
- US Citizenship and Immigration Services, Characteristics of H-1B Specialty Occupation Workers, Fiscal Year 2025 (2026). uscis.gov ↩
- US Census Bureau, S0201 Selected Population Profile, Asian Indian alone, by metro area (ACS 2019 1-year) (2020). data.census.gov ↩