
Short answer
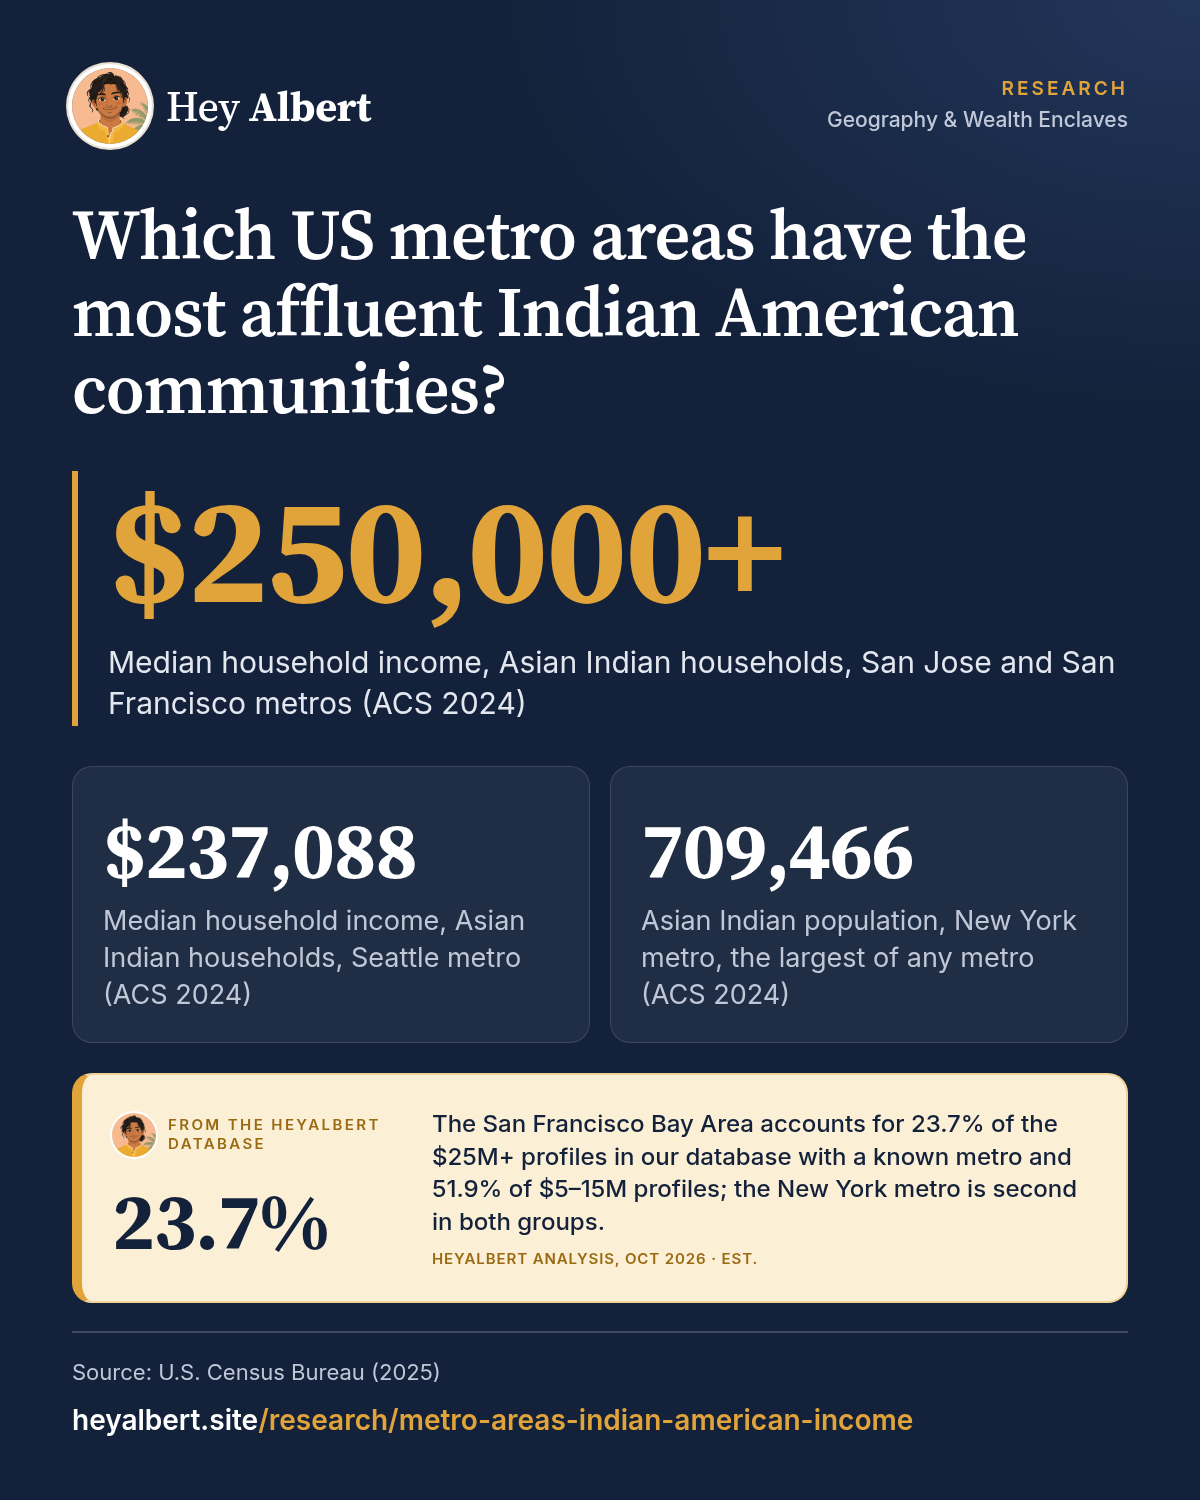
The most affluent Indian American communities are in the San Jose and San Francisco metro areas, where the median Asian Indian household income exceeds $250,000, followed by Seattle ($237,088) and Boston ($213,275), according to 2024 Census data1. The New York metro area has the largest Asian Indian population, about 709,000 people, and Dallas-Fort Worth is second with about 345,0001.
HeyAlbert data shows the San Francisco Bay Area accounts for 23.7% of the $25M+ profiles in our database with a known metro and 51.9% of $5–15M profiles; the New York metro is second in both groups. See the data · Methodology
Ranking metros by Indian American household income
The American Community Survey (ACS) publishes detailed profiles for Asian Indian residents in 17 metro areas, those large enough to meet the Census Bureau's threshold. Ranked by median household income in 2024, the top five are1:
- San Francisco-Oakland-Fremont: above $250,000
- San Jose-Sunnyvale-Santa Clara: above $250,000
- Seattle-Tacoma-Bellevue: $237,088
- Boston-Cambridge-Newton: $213,275
- Charlotte-Concord-Gastonia: $192,896
The two Bay Area metros hit the ACS ceiling of $250,000 for reported medians, so their true medians are higher than shown. Per capita income, which has no such ceiling, puts San Jose first at $125,482, then Seattle at $115,535 and San Francisco at $112,6371. Our post on why affluent Indian Americans concentrate in Silicon Valley explains the Bay Area figures.
What HeyAlbert data shows
Full table: 17 metro areas
| Metro area | Asian Indian population | Share of metro | Median household income, Asian Indian households | Median household income, all households |
|---|---|---|---|---|
| San Francisco-Oakland-Fremont, CA | 263,786 | 5.7% | $250,000+ | $135,590 |
| San Jose-Sunnyvale-Santa Clara, CA | 218,203 | 10.9% | $250,000+ | $164,801 |
| Seattle-Tacoma-Bellevue, WA | 172,407 | 4.2% | $237,088 | $112,388 |
| Boston-Cambridge-Newton, MA-NH | 117,683 | 2.3% | $213,275 | $117,825 |
| Charlotte-Concord-Gastonia, NC-SC | 71,567 | 2.5% | $192,896 | $85,938 |
| Washington-Arlington-Alexandria, DC-VA-MD-WV | 203,117 | 3.2% | $188,905 | $126,244 |
| Dallas-Fort Worth-Arlington, TX | 345,345 | 4.1% | $178,315 | $92,733 |
| Los Angeles-Long Beach-Anaheim, CA | 160,299 | 1.2% | $175,448 | $96,405 |
| Atlanta-Sandy Springs-Roswell, GA | 171,335 | 2.7% | $173,135 | $92,344 |
| Austin-Round Rock-San Marcos, TX | 101,820 | 4.0% | $169,879 | $99,897 |
| Houston-Pasadena-The Woodlands, TX | 172,224 | 2.2% | $165,850 | $81,417 |
| New York-Newark-Jersey City, NY-NJ | 709,466 | 3.6% | $164,130 | $99,852 |
| Philadelphia-Camden-Wilmington, PA-NJ-DE-MD | 147,505 | 2.3% | $162,995 | $90,850 |
| Chicago-Naperville-Elgin, IL-IN | 261,151 | 2.8% | $148,003 | $90,770 |
| Detroit-Warren-Dearborn, MI | 119,044 | 2.7% | $144,079 | $76,403 |
| Phoenix-Mesa-Chandler, AZ | 71,688 | 1.4% | $142,690 | $90,133 |
| Sacramento-Roseville-Folsom, CA | 73,464 | 3.0% | $141,536 | $98,775 |
Source: ACS 2024 1-year Selected Population Profiles, Asian Indian alone1,2. $250,000+ is the Census Bureau's top reporting band for medians. Only metros meeting the publication threshold appear.
Largest communities: New York, Dallas and the Bay Area
Income and size do not line up. The New York-Newark-Jersey City metro had 709,466 Asian Indian residents in 2024, more than twice any other metro, but its median household income of $164,130 ranks twelfth of 171. Dallas-Fort Worth is second by size with 345,3451. The Migration Policy Institute (MPI) found that about 35% of all Indian immigrants lived in five metro areas, greater New York, Dallas, San Francisco, Chicago and San Jose, in pooled 2020-24 data3.
New York's median reflects a mix of communities. It includes affluent suburbs in central New Jersey and on Long Island alongside older, lower-income neighborhoods in Queens. We profile the region in the New York metro area and its New Jersey core in Middlesex County.
Fastest growth: Texas, Seattle and the Southeast
Comparing ACS 1-year estimates for 2019 and 2024 gives a rough picture of growth. Metro boundaries were redrawn between those years, so these are approximate1,4:
- Dallas-Fort Worth: about 222,600 to 345,300, up about 55%
- Seattle: about 118,800 to 172,400, up about 45%
- Detroit: about 90,500 to 119,000, up about 32%
- San Jose: about 174,700 to 218,200, up about 25%
- Atlanta: about 138,200 to 171,300, up about 24%
Austin and Charlotte did not meet the publication threshold in 2019 but did in 2024, with 101,820 and 71,567 Asian Indian residents1. Read more in our posts on Texas and Seattle.
What separates the top metros
The highest-income metros share a profile: very high education and a concentration in technology. In the San Jose metro, 60.2% of Asian Indian adults 25 and older hold a graduate or professional degree; in Seattle, 57.0%; in Boston, 59.9%1. Nationally the Asian Indian figure is 46.4%, and for all US adults 14.7%5. In Seattle and San Jose more than a tenth of employed Asian Indians work in the information sector (12.1% and 10.6%), against 1.8% of all US workers1,5.
Other metros lean on different industries. In Charlotte, 26.0% of employed Asian Indians work in finance, insurance and real estate, reflecting the city's banking sector1. In Houston and Philadelphia, more than a quarter work in education and health care1. For the industry picture, see Indian Americans in finance and Indian American physicians.
Medians are not wealth
Household income is the best published measure, but it is not net worth. The ACS does not report wealth by detailed Asian group, and high incomes in expensive metros go with high housing costs: the median home value for Asian Indian homeowners was $1,785,700 in the San Jose metro but $482,700 in the Chicago metro1; see our profiles of Chicago and Southern California for how housing costs shape each market. For what is known about assets, see our analysis of Indian American household net worth.
Frequently asked questions
Which city has the richest Indian Americans?
By median household income, the San Jose and San Francisco metro areas, where the median Asian Indian household earns more than $250,000. Seattle and Boston follow.
Which metro area has the most Indian Americans?
The New York-Newark-Jersey City metro area, with about 709,000 people who identify as Asian Indian alone in 2024. Dallas-Fort Worth is second with about 345,000.
Which metro areas are growing fastest?
Dallas-Fort Worth and Seattle grew fastest among large metros between 2019 and 2024, by roughly 55% and 45%, based on ACS 1-year estimates. Metro boundaries changed in that period, so the figures are approximate.
Is Indian American income the same as wealth?
No. Census data report household income, not net worth, for Indian Americans. High incomes in costly metros come with very high housing prices.
Sources
Figures are from the public sources below, with the data year stated. Estimates are labeled as estimates. Accessed October 24, 2026.
- US Census Bureau, S0201 Selected Population Profile, Asian Indian alone, by metro area (ACS 2024 1-year) (2025). data.census.gov ↩ ↩ ↩
- US Census Bureau, S0201 Selected Population Profile, total population, by metro area (ACS 2024 1-year) (2025). data.census.gov ↩
- Migration Policy Institute, Indian Immigrants in the United States (2026). migrationpolicy.org ↩ ↩
- US Census Bureau, S0201 Selected Population Profile, Asian Indian alone, by metro area (ACS 2019 1-year) (2020). data.census.gov ↩ ↩
- US Census Bureau, S0201 Selected Population Profile, Asian Indian alone and total population, United States (ACS 2024 1-year) (2025). data.census.gov ↩ ↩